3.2.1. Python projects
3.2.1.1. Setting up a Python project
Start VSCode and make sure you are working in the Lab C folder. If needed, on the menu bar select
Terminal / New Terminaland select Lab C, to make a terminal in the correct location.In the VSCode terminal enter:
cd /workspaces/`ls /workspaces`/lab-c uv init .
Remember to enter these one at a time, not both together.
This will make a new Python project in the current folder. It will be named automatically after the folder name.
To analyze these lines:
cd /workspaces/`ls /workspaces`/lab-cmakes sure we are working in the lab-c folder.uv init .is the interesting command. It makes a simple pyproject.toml file to define the project.
Note that we haven’t made a virtual environment yet.
uv init .just defines a new project. The virtual environment is made later, when we try to run code.You’ll see that three files have been automatically created for you:
.python-versionpyproject.tomlmain.py
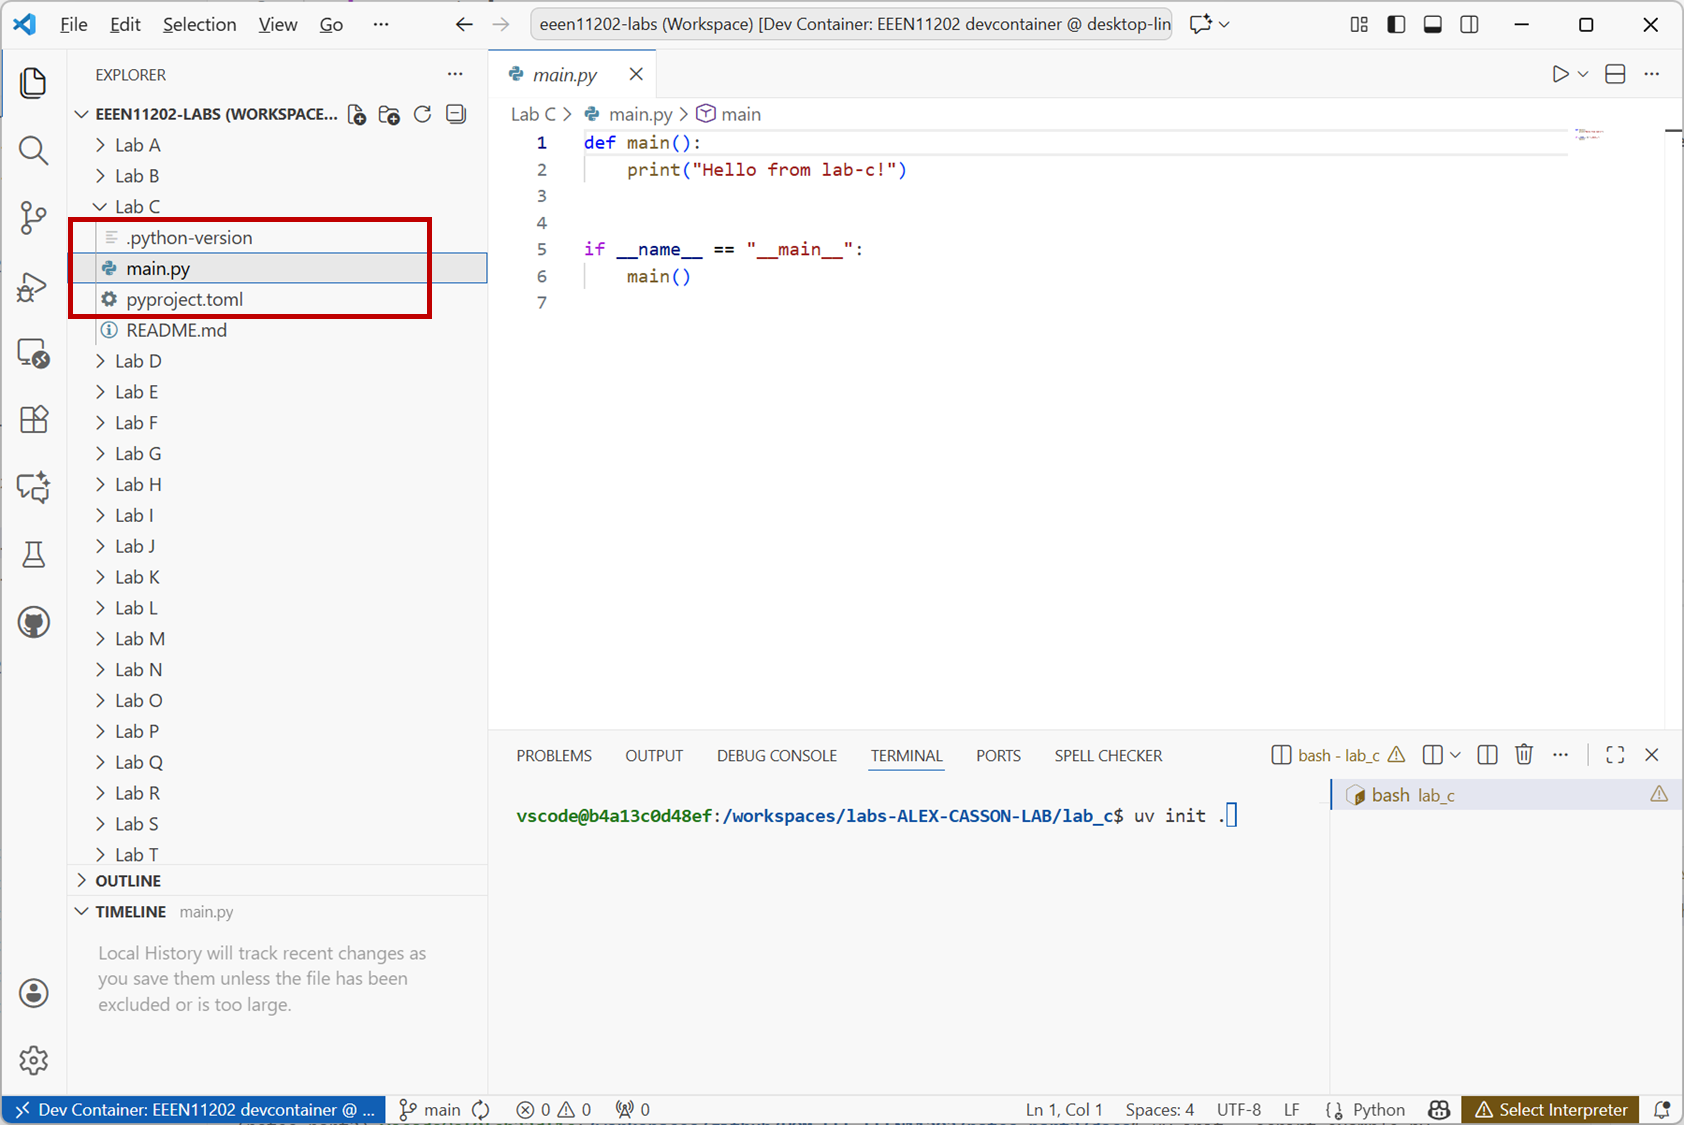
Screenshot of VSCode, software from Microsoft. See course copyright statement.
.python-versionsets the Python version to use. We don’t need to look at it, it will have been set to a default version.Open the
pyproject.tomlfile. This will look like[project] name = "lab-c" version = "0.1.0" description = "Add your description here" readme = "README.md" requires-python = ">=3.14" dependencies = []
The project has been given a name (
lab-c) based on the folder name. There’s the option to give a version number and some description. At the moment we haven’t added any dependencies, so thedependencieslist is empty.Open the
main.pyfile. This is where our Python code will go. We can of course change the file name if we would like to. You’ll see that some boilerplate code has been added to get starteddef main(): print("Hello from lab-c!") if __name__ == "__main__": main()
Run the code by entering the command
uv run main.pyYou’ll see
Hello from lab-c!displayed in the terminal. You’ll also see that a virtual environment has been automatically created and is being used. (Theuv init .command doesn’t actually make the environment for you, it just makes the files that say what should be in the environment.) Due to the setup of VSCode, the graphical buttons to run a Python script won’t work until the virtual environment has been created.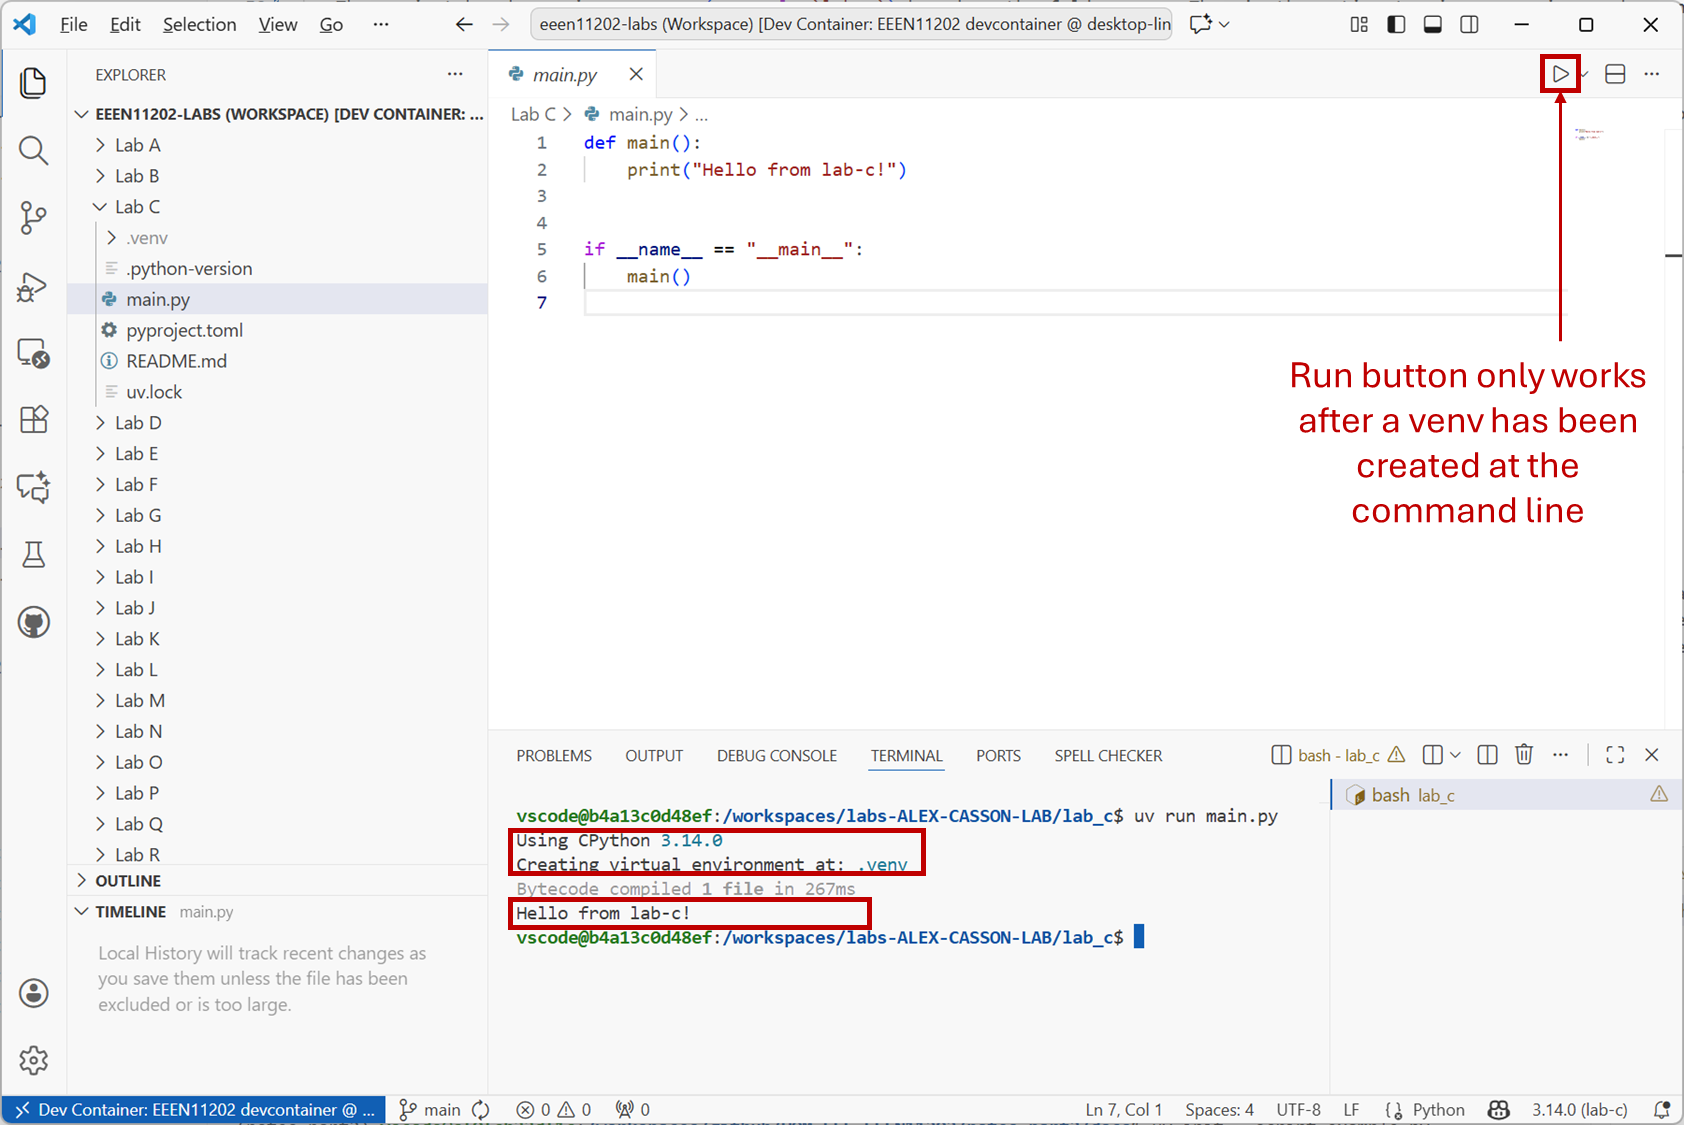
Screenshot of VSCode, software from Microsoft. See course copyright statement.
main.pyuses functions. The block inif __name__ == "__main__":is what is actually run when the code starts. Here it just calls the function calledmain.A function is defined with the
defkeyword, followed by the name of the function. Here the functionmainjust displays some text to the screen.Good practice is generally to do as little as possible under
if __name__ == "__main__":and instead put most of the code in functions. This makes it easier to test the code later, as we’ll learn about in Lab D.
3.2.1.2. Porting the sine wave example from Lab B
In Lab B you wrote a Python script to plot a sine wave. Let’s repeat that example, but using the new project structure.
Replace the code in your
main.pyfile with the followingimport math import plotly.express as px def make_sine_wave(): """ Make a sine wave signal TO DO: replace range with a numpy array Returns: t: time samples v_out: voltage samples """ sample_start = 0 sample_stop = 100 A = 1 # Volts f = 0.1 # Hz t = range(sample_start, sample_stop) # interpret as representing 1 s, 2 s, 3 s, ... v_out = [A * math.sin(2 * math.pi * f * time) for time in t] return t, v_out def plot_sine_wave(t, v_out): """Plot a sine wave using plotly and label the axes""" fig = px.line(x=t, y=v_out, labels={"x": "Time [s]", "y": "Voltage [V]"}) fig.show() if __name__ == "__main__": t, v_out = make_sine_wave() plot_sine_wave(t, v_out)
This requires the external library
plotly, so we need to add that as a dependency. (It also needsnumpyandpandas.) If you press the Run button before installing these dependencies, the program won’t work.To install the dependencies, at the terminal enter
uv add plotly numpy pandas ipykernel==6.31.0Once the dependencies are installed, you can run the code with
uv run main.pyor by using the Run button in VSCode.
You should see the sine wave plot displayed as a graph in a web browser. You can use the buttons in this to zoom in, and so on, to explore the plot
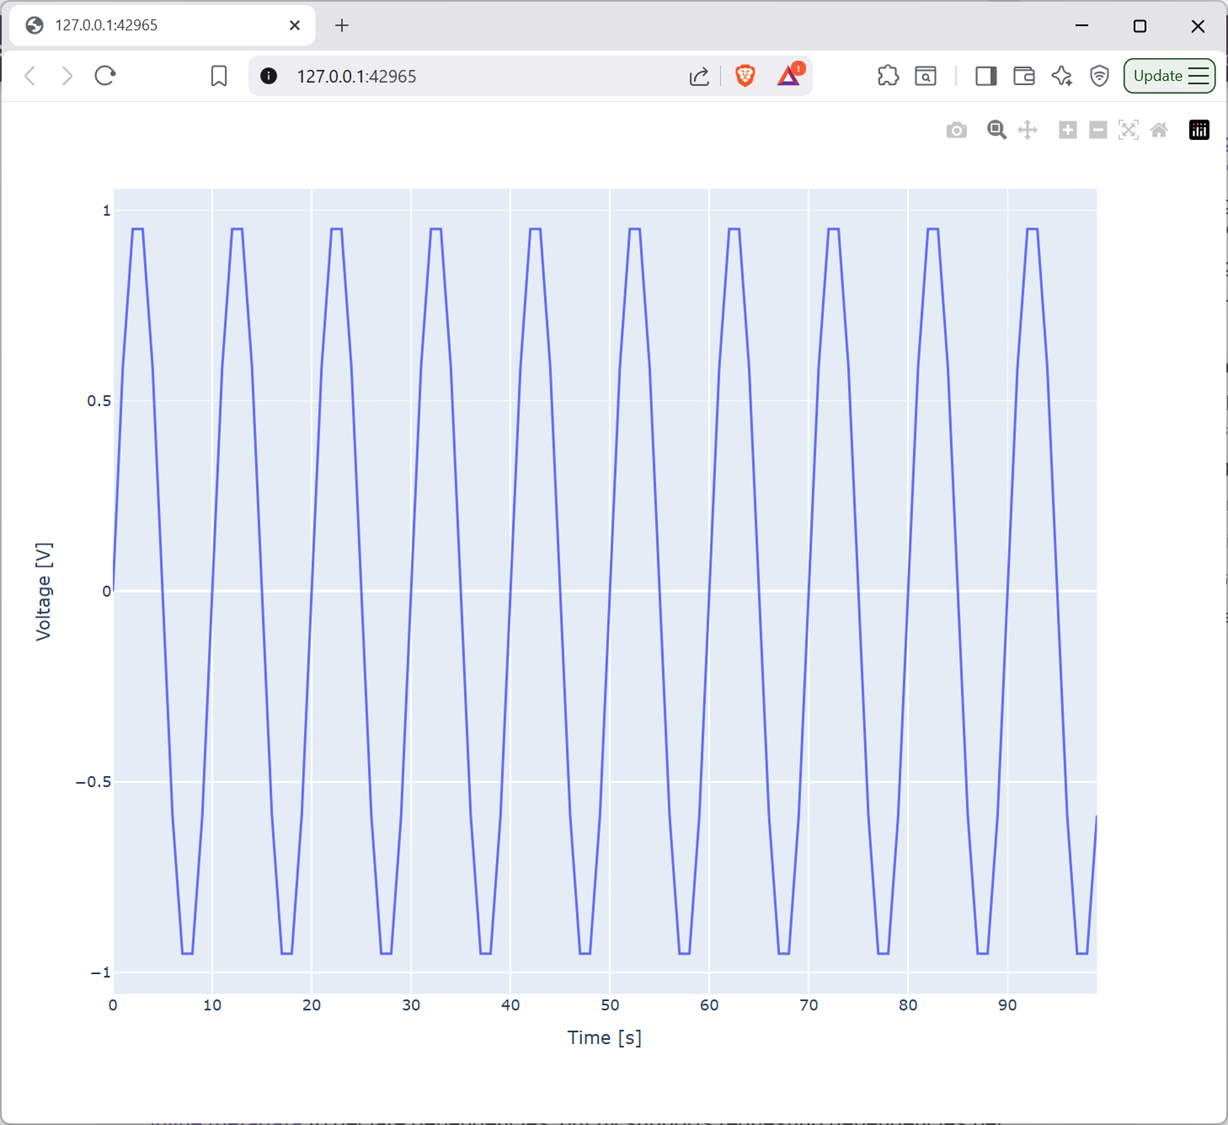
Screenshot of a web browser, software from Brave. See course copyright statement.
Although the above example is brief, there’s lots to explore and think about.
Firstly, open the
pyproject.tomlfile again. It will now contain something like[project] name = "lab-c" version = "0.1.0" description = "Add your description here" readme = "README.md" requires-python = ">=3.14" dependencies = [ "numpy>=2.3.5", "pandas>=2.3.3", "plotly>=6.4.0", ]
It now contains details on what version of Python, and the external libraries, are needed for the code to run. If you were to share this project with someone else, they could use this file to set up their own virtual environment with the correct dependencies automatically. (There is a
uv synccommand to make a virtual environment match apyproject.tomlfile.)For a small project like this, the precise versions of the different tools used probably doesn’t matter too much. However, it can be very important for larger projects developed over a period of time.
Secondly, the code that runs when the program starts is
if __name__ == "__main__":
    t, v_out = make_sine_wave()
    plot_sine_wave(t, v_out)
The aim is for this in
mainto be readable, by inspection, to see that the code does what we want it to conceptually. This is easy when there’s only two steps as in the above, we want to make a sine wave and then plot it.To understand the other parts of the code:
make_sine_wave()doesn’t take any inputs, there’s nothing between the brackets().plot_sine_wave(t, v_out)takes two inputs. These inputs are the outputs ofmake_sine_wave(), assigned by placing them on the left hand side of the=sign.Inside the definition of the
make_sine_wave()function, the two outputs are defined by thereturnstatement.Inside the definition of the
plot_sine_wave(t, v_out)function, the two inputs are defined by the items between the brackets(t, v_out). Otherwise, the Python code is unchanged from previously (just indented to show which code belongs to which block).Both functions start with a docstring to add some documentation.
3.2.1.3. Porting the RC circuit simulation example from Lab B
Let’s now port the other example that we had in Lab B, the RC circuit simulation. This was simulating the potential divider shown below
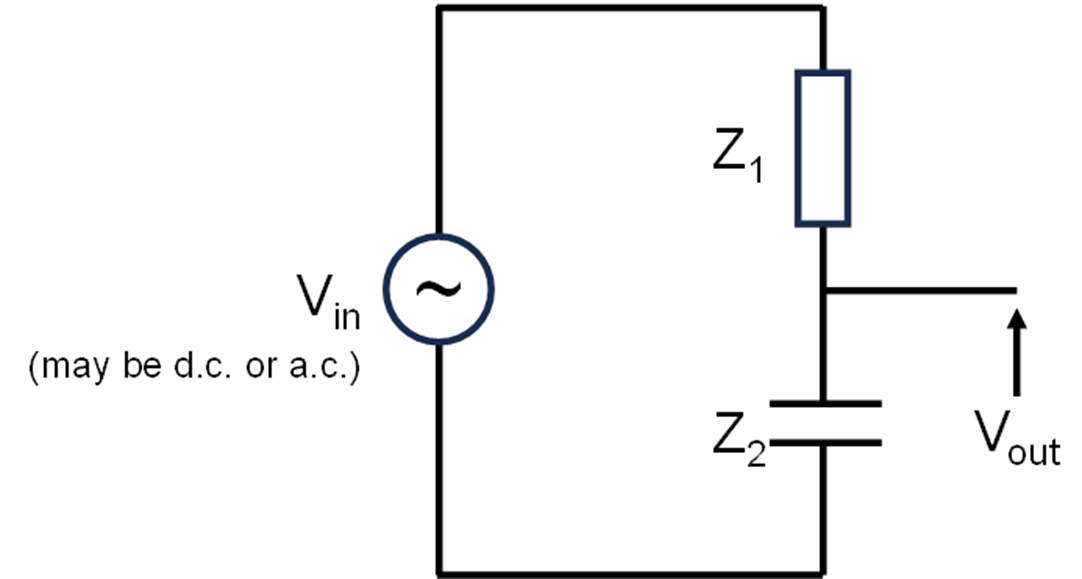
where \(Z_{1}\) is a resistor and \(Z_{2}\) is a capacitor with impedance
where \(\omega\) is the angular frequency
The output voltage is given by
Your code in Lab B will have looked like the below. This is for \(V_{in}\) of 5 V, \(Z_{1}\) being a resistor of 1 k:math:Omega, and \(Z_{2}\) being a capacitor of 1 nF.
# Potential divider where z2 is a capacitor
import cmath
import math

f = 160000  # Hz
w = 2 * math.pi * f  # rad/s

a = 5 # input amplitude in Volts
v_in = a * cmath.exp(0j)  # phasor representation. 0 degree signal

z1 = 1e3  # Ohms
c = 1e-9  # Farads
z2 = 1 / (1j * w * c)

v_out = (z2 * v_in) / (z1 + z2)  # Volts
vout_mag = abs(v_out)
vout_phase = cmath.phase(v_out)
Refactor this code to use an
if __name__ == "__main__":block and functions, similar to the sine wave example above. Also, add code to displayvout_magandvout_phaseto the screen.In your Lab C files you will see that a number of files have been pre-downloaded for you. A file called
lpf.pywhich contains some starter code for this task. Open in. Inside the file,...indicates where you need to add code.Solution
"""
Calculate the output voltage magnitude and phase of an RC low-pass filter
"""

import cmath
import math


def calculate_circuit_output(f):
    """
    Calculate the output voltage magnitude and phase of an RC low-pass filter
    given an input frequency f in Hz.
    Returns: vout_mag: output voltage magnitude in Volts
             vout_phase: output voltage phase in radians
    """

    # Calculate input
    w = 2 * math.pi * f  # rad/s
    a = 5 # input amplitude in Volts
    v_in = a * cmath.exp(0j)  # phasor representation. 0 degree signal

    # Define the circuit
    z1 = 1e3  # Ohms
    c = 1e-9  # Farads
    z2 = 1 / (1j * w * c)
    v_out = (z2 * v_in) / (z1 + z2)  # Volts

    # Calculate magnitude and phase
    vout_mag = abs(v_out)
    vout_phase = cmath.phase(v_out)

    return vout_mag, vout_phase


def display_results(vout_mag, vout_phase):
    """Display the output voltage magnitude and phase using an f string"""
    print(f"Output voltage magnitude: {vout_mag} V")
    print(f"Output voltage phase: {vout_phase} radians")


if __name__ == "__main__":
    f = input("Enter frequency in Hz: ")  # remember f will be a string
    vout_mag, vout_phase = calculate_circuit_output(float(f))
    display_results(vout_mag, vout_phase)
In practice in electronics it’s common to display \(V_{out}\) not as a Voltage, but as the gain of the circuit. That is, the ratio
\[G = \frac{V_{out}}{V_{in}}\]Moreover, this is usually expressed in decibels (dB) by using the equation
\[G_{dB} = 20 \log_{10}\left(\frac{V_{out}}{V_{in}}\right)\]Modify your code to display the gain in dB instead of the output voltage magnitude.
Solution
"""
Calculate the output voltage magnitude and phase of an RC low-pass filter
"""

import cmath
import math


def calculate_circuit_output(f):
    """
    Calculate the output voltage magnitude and phase of an RC low-pass filter
    given an input frequency f in Hz.
    Returns: vout_mag: output voltage magnitude in Volts
             vout_phase: output voltage phase in radians
    """

    # Calculate input
    w = 2 * math.pi * f  # rad/s
    a = 5  # input amplitude in Volts
    v_in = a * cmath.exp(0j)  # phasor representation. 0 degree signal

    # Define the circuit
    z1 = 1e3  # Ohms
    c = 1e-9  # Farads
    z2 = 1 / (1j * w * c)
    v_out = (z2 * v_in) / (z1 + z2)  # Volts

    # Calculate magnitude and phase
    vout_mag = abs(v_out)
    vout_mag_db = 20 * math.log10(
        vout_mag / a
    )  # remember to divide by the input amplitude
    vout_phase = cmath.phase(v_out)

    return vout_mag_db, vout_phase


def display_results(vout_mag, vout_phase):
    """Display the output voltage magnitude and phase using an f string"""
    print(f"Output voltage magnitude: {vout_mag} dB")
    print(f"Output voltage phase: {vout_phase} radians")


if __name__ == "__main__":
    f = input("Enter frequency in Hz: ")  # remember f will be a string
    vout_mag, vout_phase = calculate_circuit_output(float(f))
    display_results(vout_mag, vout_phase)
Check in your code to Git before proceeding.
Click on the
Source Controltab in the left hand menu. You may need to clickRefreshfor it to pick up your changes.Enter a message such as “Completed the first part of Lab C” in the message box.
Click
Commit. This checks the files in to the local repository.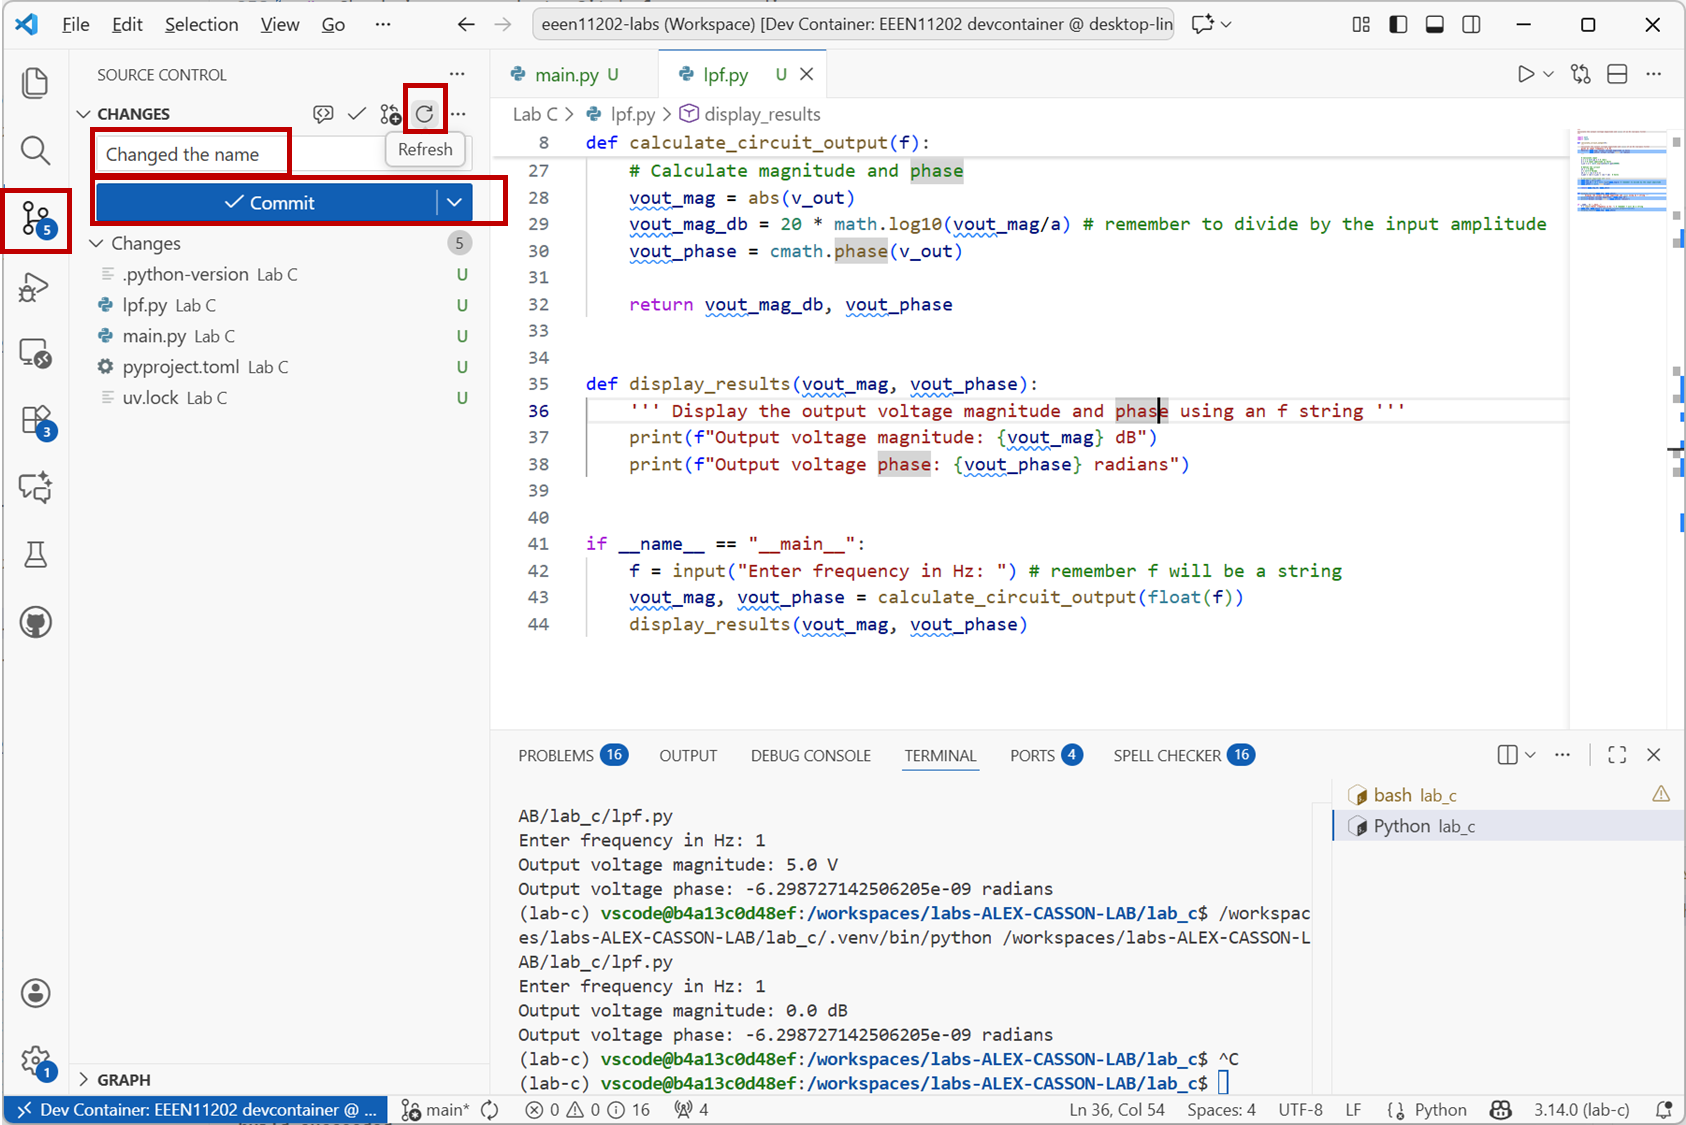
Screenshot of VSCode, software from Microsoft. See course copyright statement.
Click
Sync Changes. This checks the files in to the remote repository.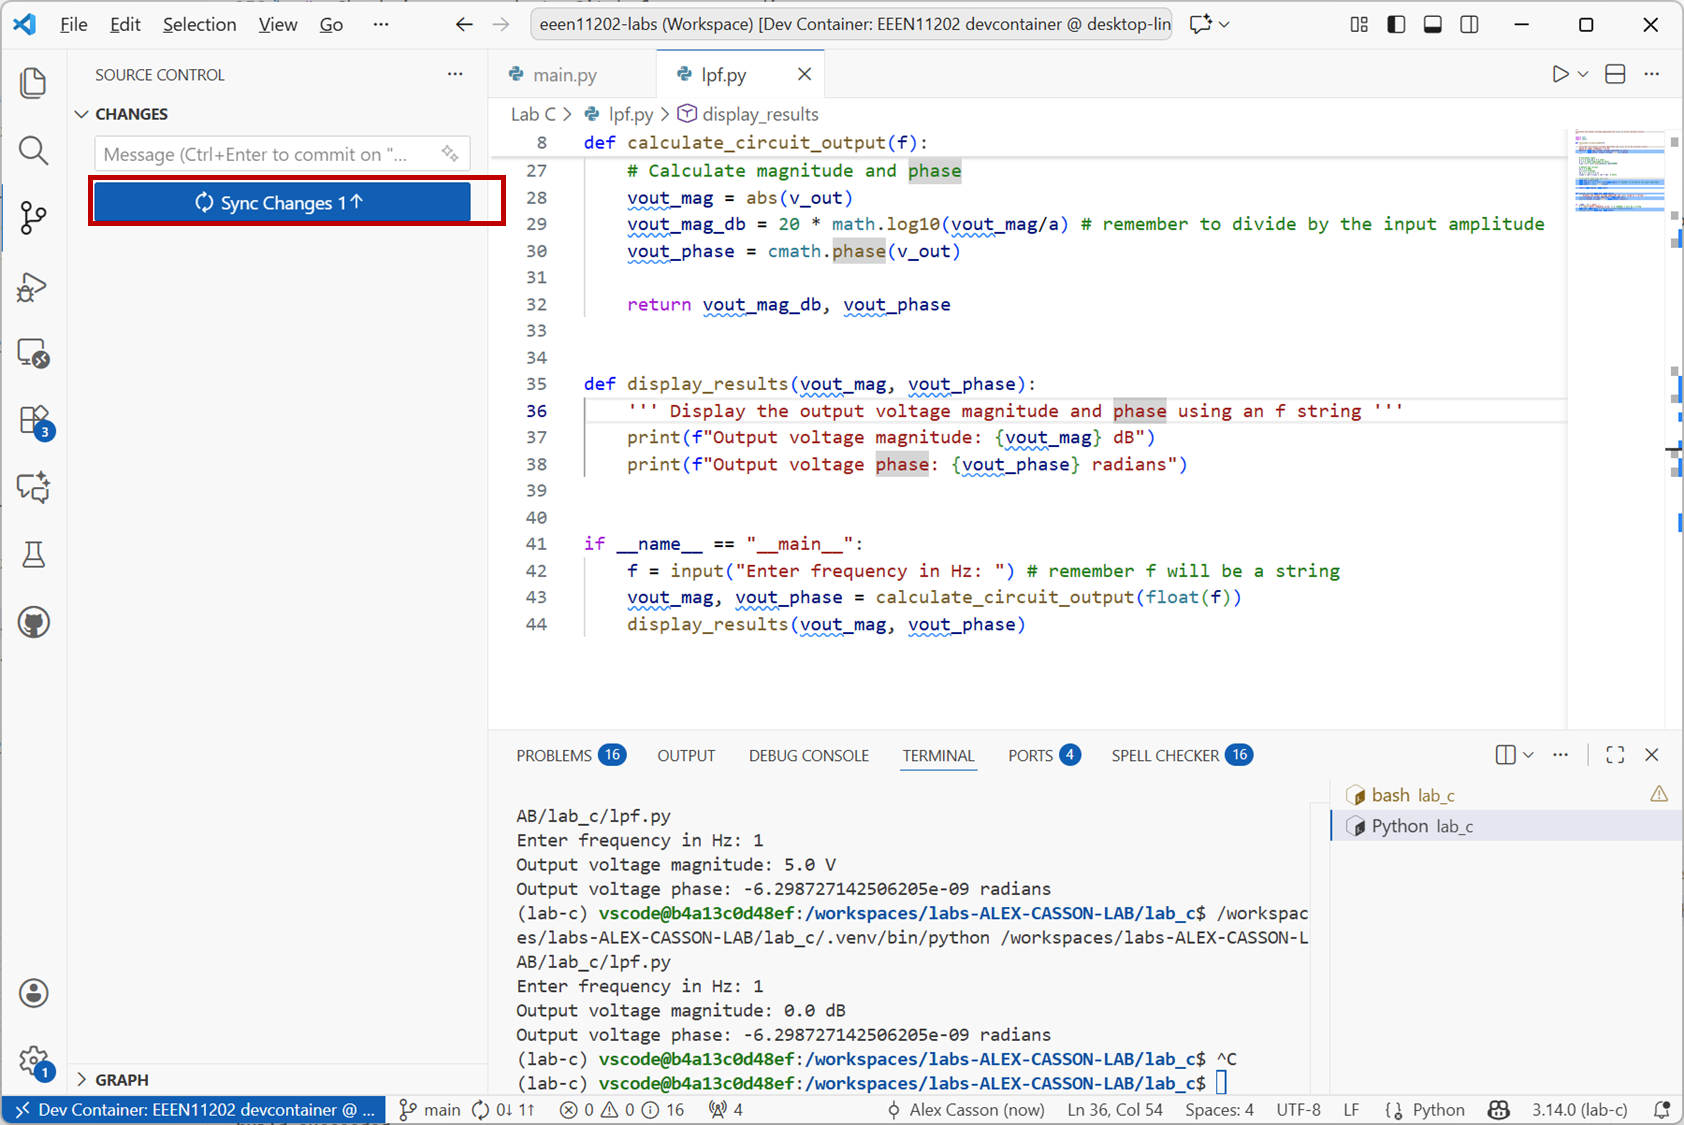
Screenshot of VSCode, software from Microsoft. See course copyright statement.
Enter the commands
git commit -a -m "Completed the first part of Lab C"
git pull
git push