3.3.1. Tools and techniques for catching coding issues
3.3.1.1. Initial setup for the Lab
In the VSCode terminal enter:
cd /workspaces/`ls /workspaces` && mkdir -p lab-d cd /workspaces/`ls /workspaces`/lab-d uv init .
Remember to enter these one at a time, not both together.
This will make a new Python project in the current folder. It will be named automatically after the folder name.
To analyze these lines:
cd /workspaces/`ls /workspaces` && mkdir -p lab-dmakes the lab-d folder. There are no pre-downloaded files needed for Lab D. Sometimes this means that the Lab D folder isn’t downloaded automatically (because it’s empty).cd /workspaces/`ls /workspaces`/lab-dmakes sure we are working in the lab-d folder.uv init .is the interesting command. It makes a simple pyproject.toml file to define the project. (The actual virtual environment is made automatically when we run code.)
The above will make the a
pyproject.tomlfile, amain.pyfile, and a number of others.We’re now going to add a bit more structure to our code folder, as we discussed in the theory part for Week 3. We’re just going to:
Make a folder called
src, and put our code files (justmain.pyat the moment) in there.Make a folder called
tests. At the moment this will be empty, but we’ll put some unit tests in there in the second part of the lab.Make a folder called
docs. This is where the documentation for the code will live. We’re going to keep this empty, as we won’t focus on writing documentation in this lab. Nevertheless, we’re going to make it to help remind you that for actual projects there should be some documentation files to accompany your code.Make an empty
__init__.pyfile in thetestsfolder. This is needed for the unit testing setup later on.Run the boilerplate
main.pyfile so that a virtual environment gets made.
Make sure that your terminal is in your Lab D folder, and then enter:
mkdir src tests docs
mv main.py src
uv run src/main.py
touch tests/__init__.py
Aside
To keep our setup slightly simpler, we’re going to put our code directly in the
srcfolder. It’s common to actually put the code in a sub-folder withinsrcwith the same name as the project, e.g.lab_d. This helps to avoid potential naming conflicts with other packages, but for this lab we’ll keep it simple.When done, your VSCode should look like the below.
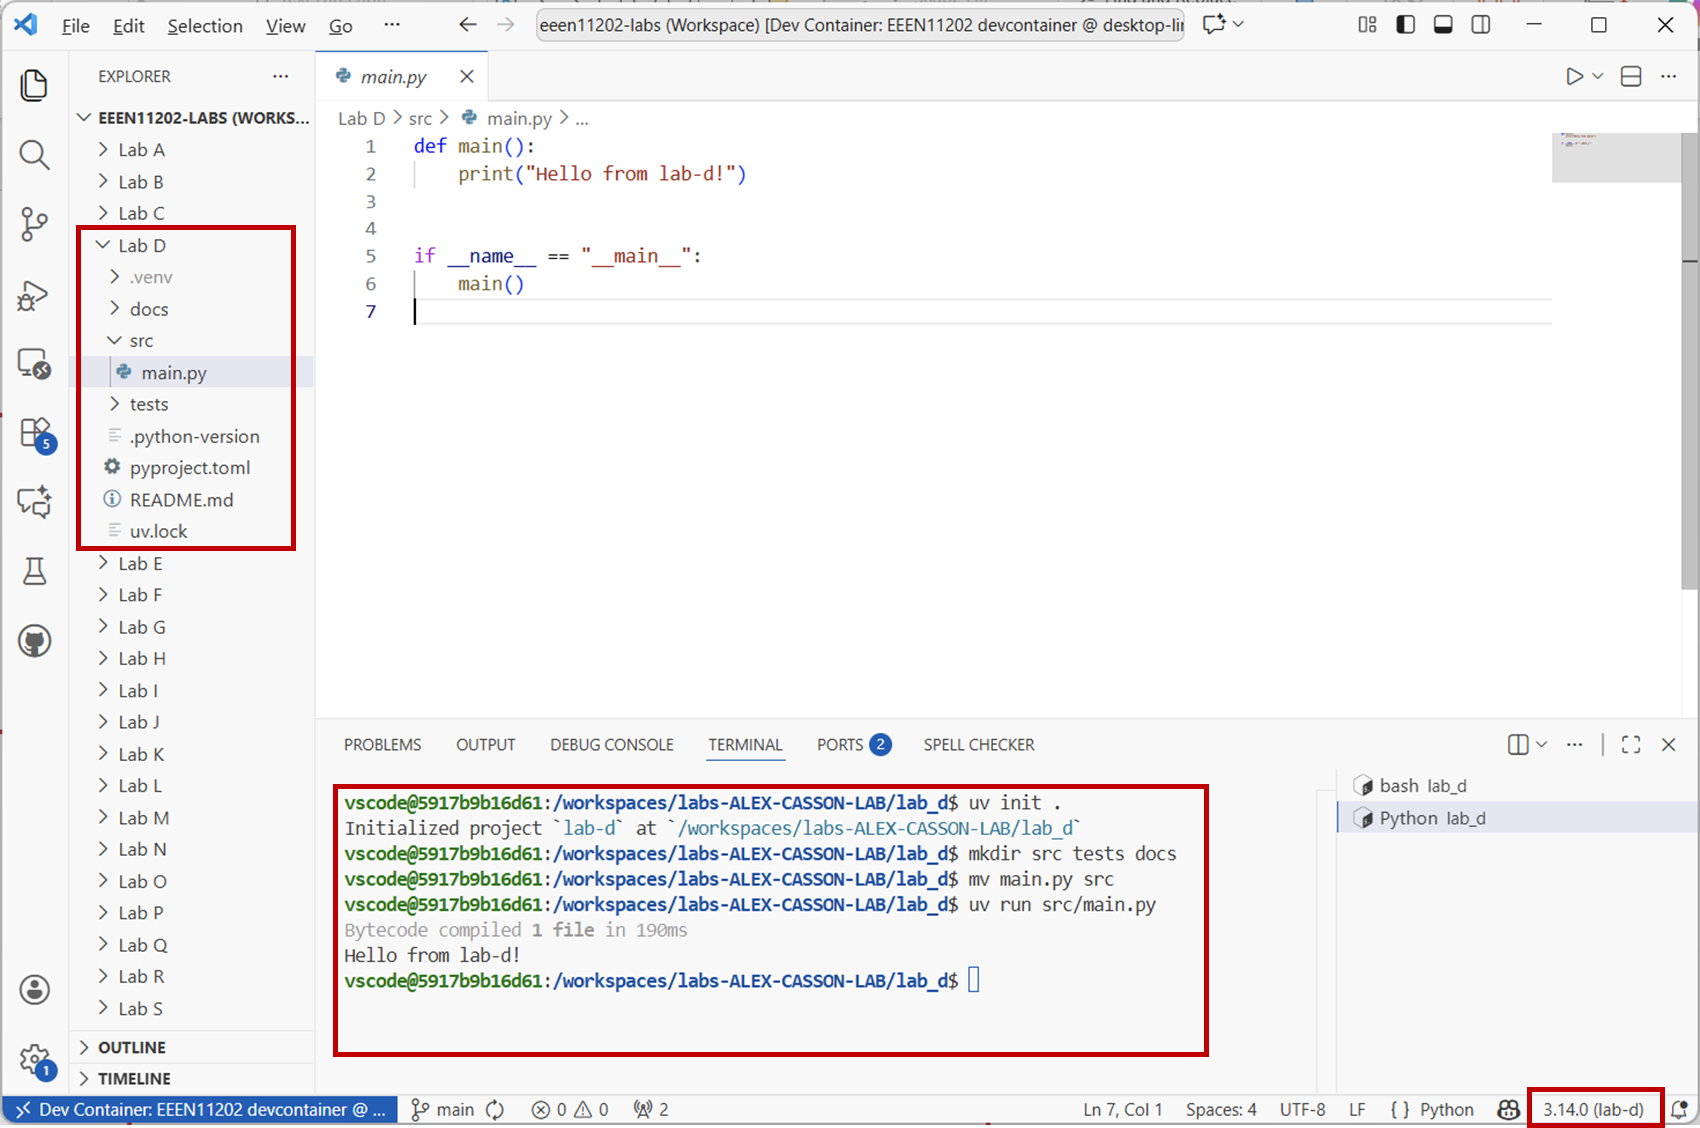
Screenshot of VSCode, software from Microsoft. See course copyright statement.
Once you’ve opened a Python file, make sure that VSCode says it’s using the
lab-dvirtual environment. This will be shown in the bottom right hand corner of the screen. If it’s picked a different virtual environment, you can click on the environment name and select the correct one, as shown below.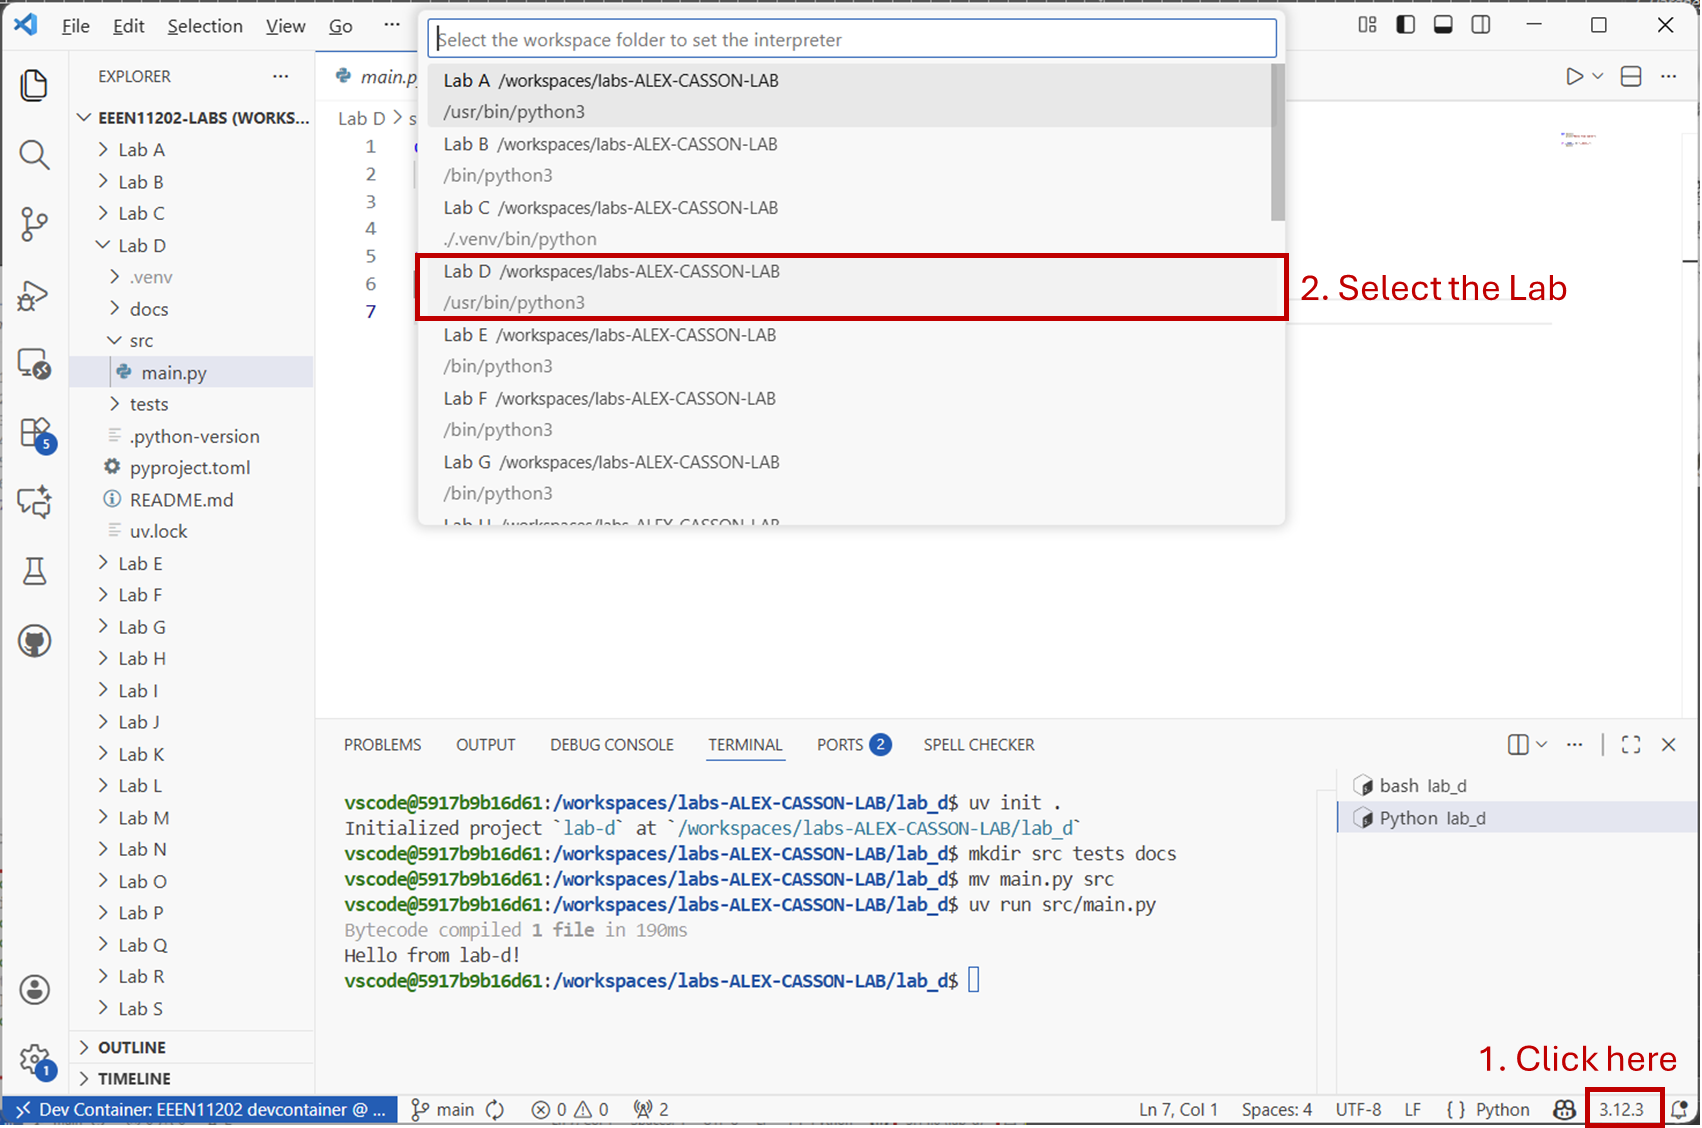
Screenshot of VSCode, software from Microsoft. See course copyright statement.
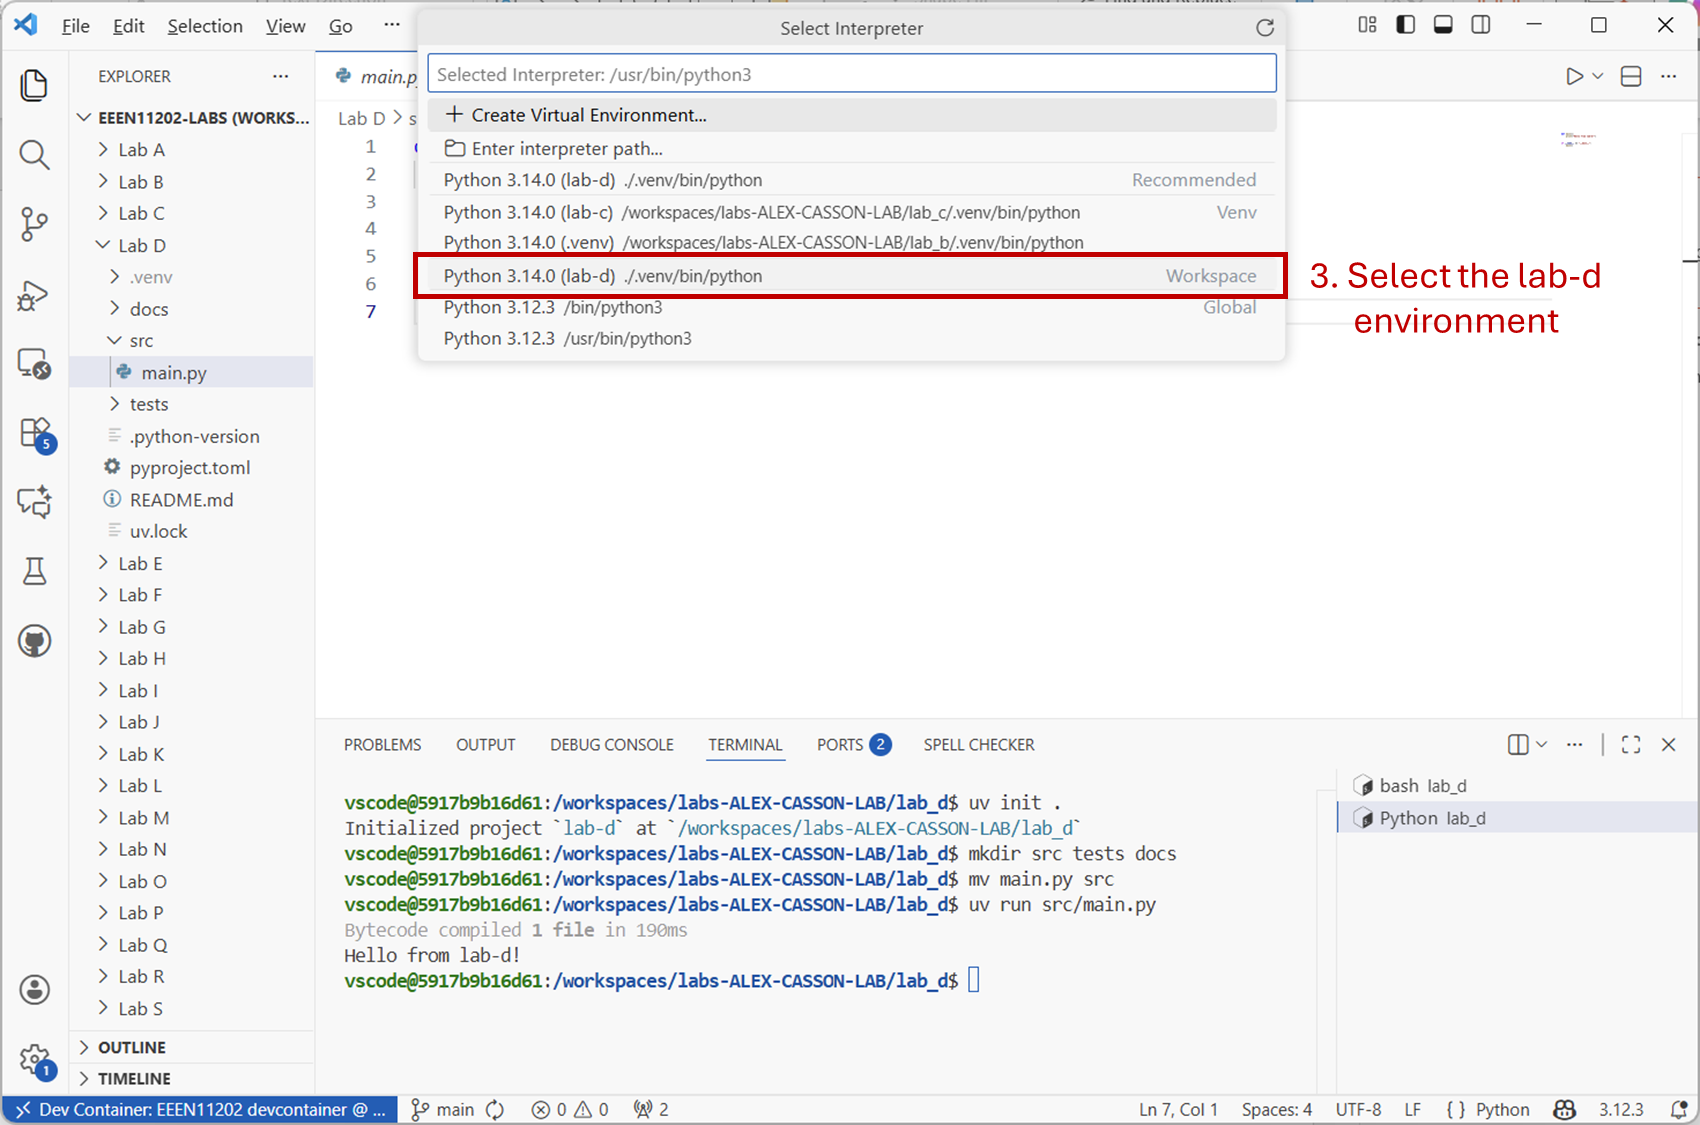
Screenshot of VSCode, software from Microsoft. See course copyright statement.
3.3.1.2. Static code analysis
You’ve probably already seen the static code analysis at work. It underlines pieces of your code, like a spell checker does, to help spot issues before you run the code. In our devcontainer we automatically installed the Ruff analyser for you. We’ll just look at static code analysis very briefly here.
Replace the code in your
main.pyfile with the code below.def main() print(Hello from lab-d!") x == 9 y = 5 if x > y: print(f"x is greater than {y}") else if x == y print(f"x is {y}") elsif x < y: print(f"x is less than {y}") else: raise ValueError("Unexpected comparison result") if __name__ == "__main__": main()
This code has quite a few mistakes in it! If you hover over the red underlined sections, VSCode will display help, to try and help you identify the issue(s) with the code.
Fix this code.
Solution
def main():
    print("Hello from lab-d!")
    x = 9
    y = 5
    if x > y:
        print(f"x is greater than {y}")
    elif x == y:
        print(f"x is {y}")
    elif x < y:
        print(f"x is less than {y}")
    else:
       raise ValueError("Unexpected comparison result")


if __name__ == "__main__":
    a = 56  # used in the next part of the lab
    x = 3.54  # used in the next part of the lab
    main()
3.3.1.3. The debugger
The debugger lets the program pause during its execution. We can then examine the state of the program, the variables and similar, to see whether they are what we would expect. We can use this to help track down issues with the code. In the second part of Lab C we used the Jupyter variable explorer to similarly look at variables, but the debugger is more versatile and flexible for when you move on to more complicated programs.
Advanced notes
This is because the Jupyter variable explorer can only show what’s in the current scope. It can’t show the values of variables inside different functions, whereas the debugger can. You can turn on a debugger within a Jupyter notebook if you want to, but we won’t look into it here.
3.3.1.3.1. General debugging
To use the debugger, you add a breakpoint. Execution of the program proceeds as usual, until it reaches a breakpoint. It then stops, and shows a debugging view. You can have as many breakpoints as you would like in different places in your code, we’ll just use one below.
Copy the solution given above into your code file. (We suggest you use our given solution rather than your own code because we’ll refer to some line number below, which might be different in your code.)
Add a breakpoint on Line 5 of the code (assuming you’ve copied the solution given above). To do this, click next to the line number. A red circle should appear, indicating that the code will stop running when it gets to this point.
Ask VSCode to debug the Python file. Click the down arrow next to the
Runbutton, and then selectPython Debugger: Debug Python File.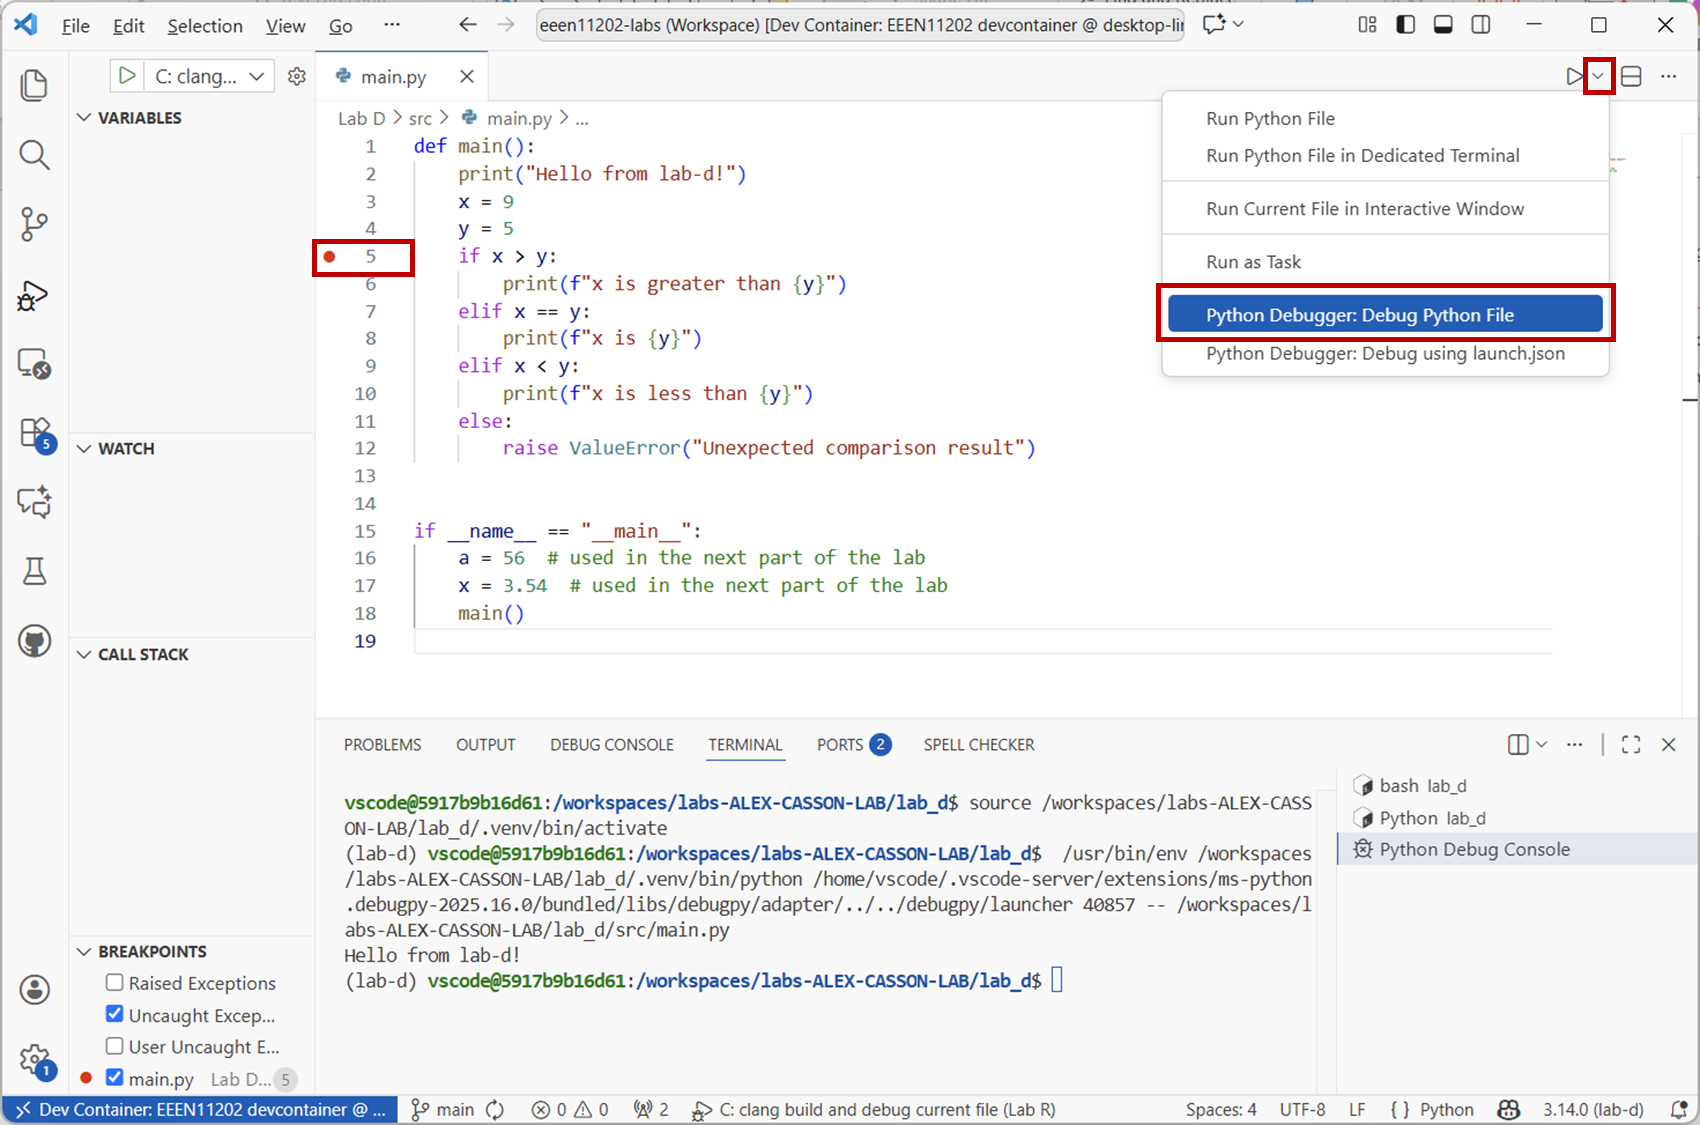
Screenshot of VSCode, software from Microsoft. See course copyright statement.
You’ll be presented with a view, highlighting Line 5. Line 5 hasn’t been run yet, all of the code up to this point has been run. Remember, the code doesn’t necessarily run from top-to-bottom. Here the code starts with the
if __name__ == "__main__":block, which then called the functionmain().The values of
xandyare shown. You can compare these against what would you expect them to be.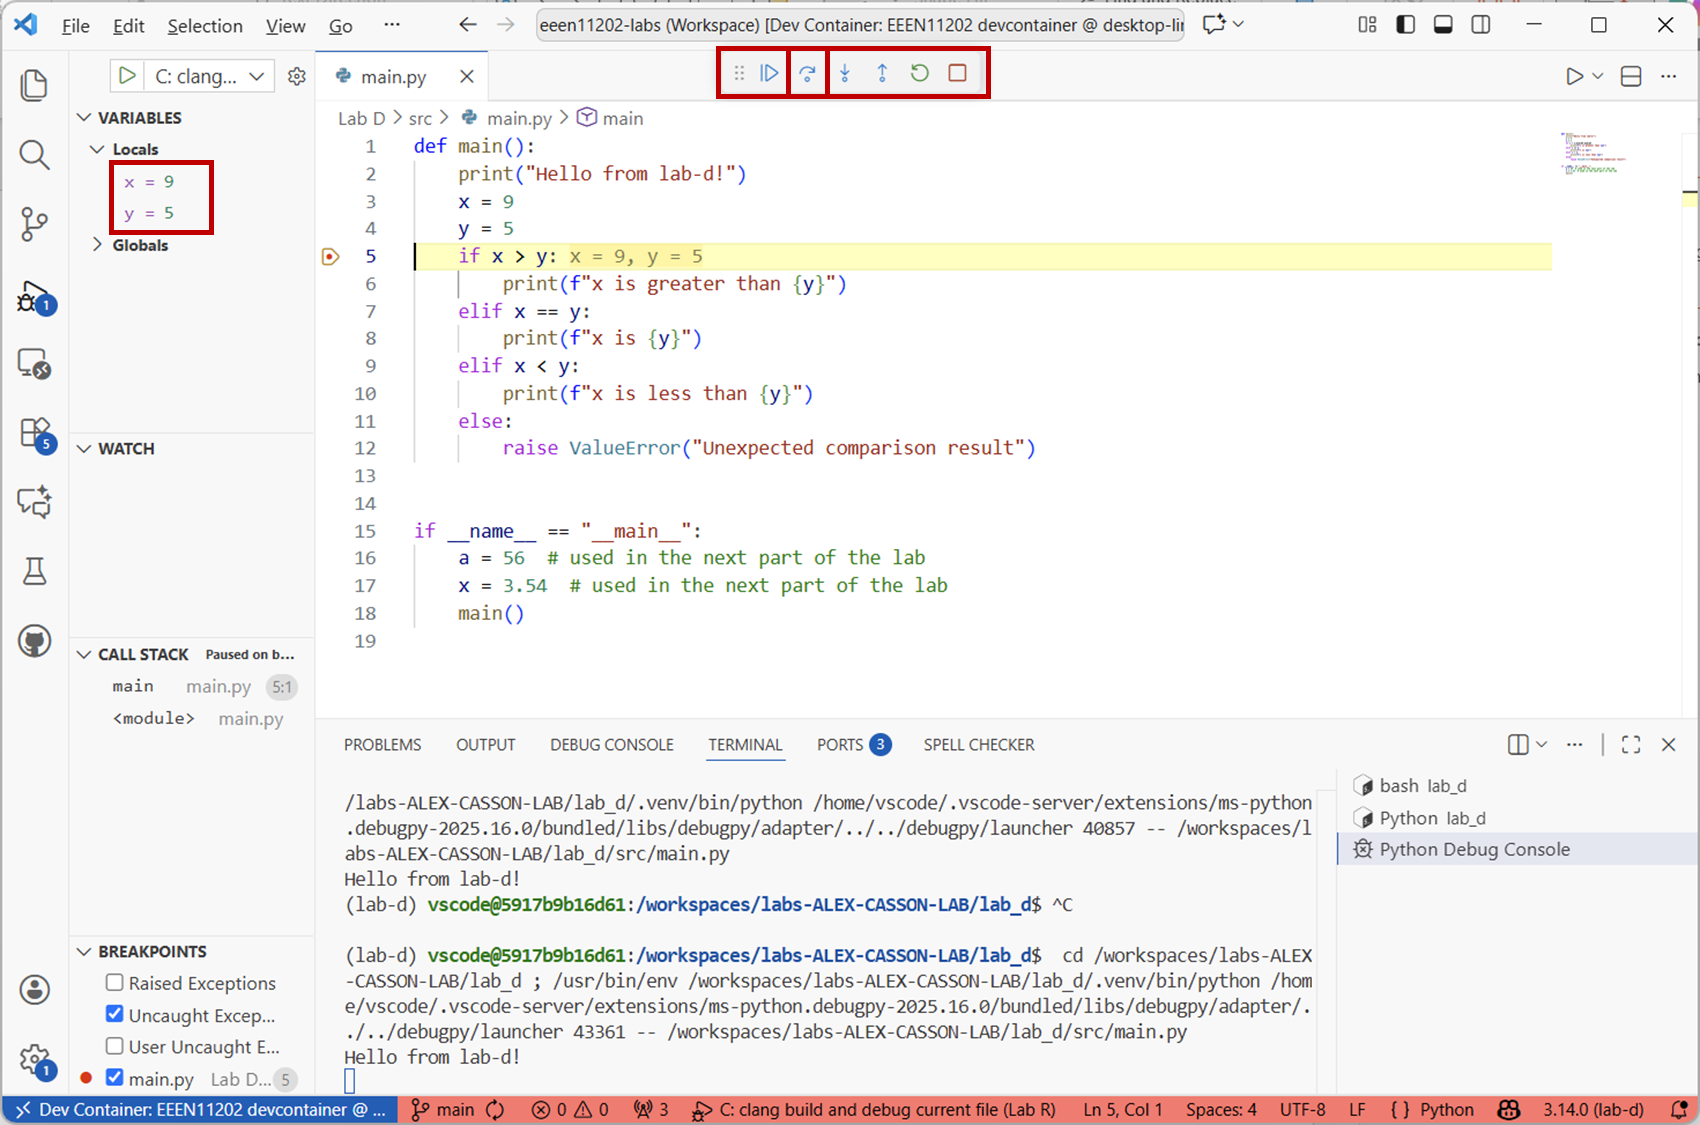
Screenshot of VSCode, software from Microsoft. See course copyright statement.
You’ll also see a set of controls presented. Hover the mouse over these to see what each button does. Briefly:
Continueresumes execution of the program. It will run until it reaches another breakpoint, or until it reaches the end of the program, whichever is sooner.Step overadvances the execution by 1 line. This is really helpful for stepping through the code line by line to find issues.Step intoadvances the execution, and if there’s a function, moves the debugger into the function. Otherwise,Step overjust runs the function and puts the results into the debugger without looking inside the function.
There are also buttons to
Restartthe debugger and toStop.Spend some time exploring these different options. Stop the debugger when you’re ready.
3.3.1.3.2. Changing the value of a variable
The debugger is an interactive tool, to help us understand our programs (and why they might not be working). Right click on the
xvariable that’s displayed in the debugger. Click onSet Value, and you’ll be able to change the value ofx.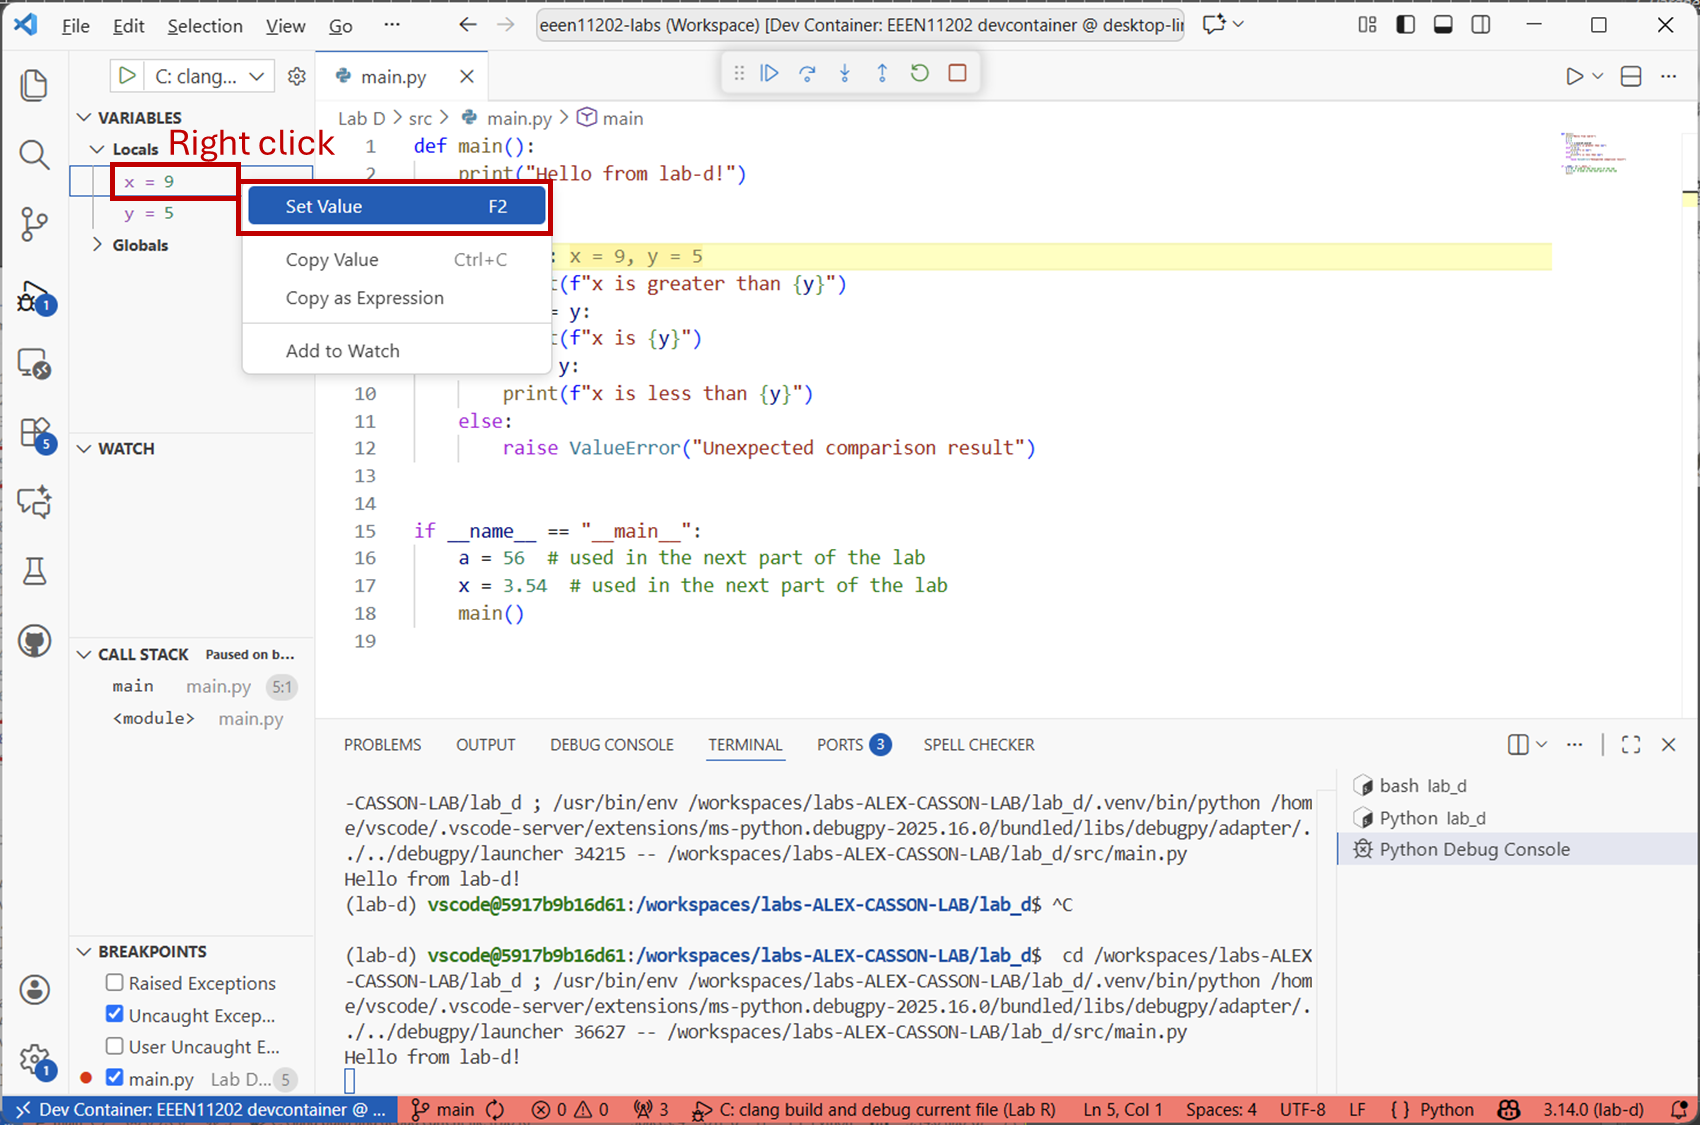
Screenshot of VSCode, software from Microsoft. See course copyright statement.
Set the value of
xto 5 and then press theStep Overbutton. You should see that theifstatement now goes down a different route. This can be very useful for checking different options, without having to re-run all of the code.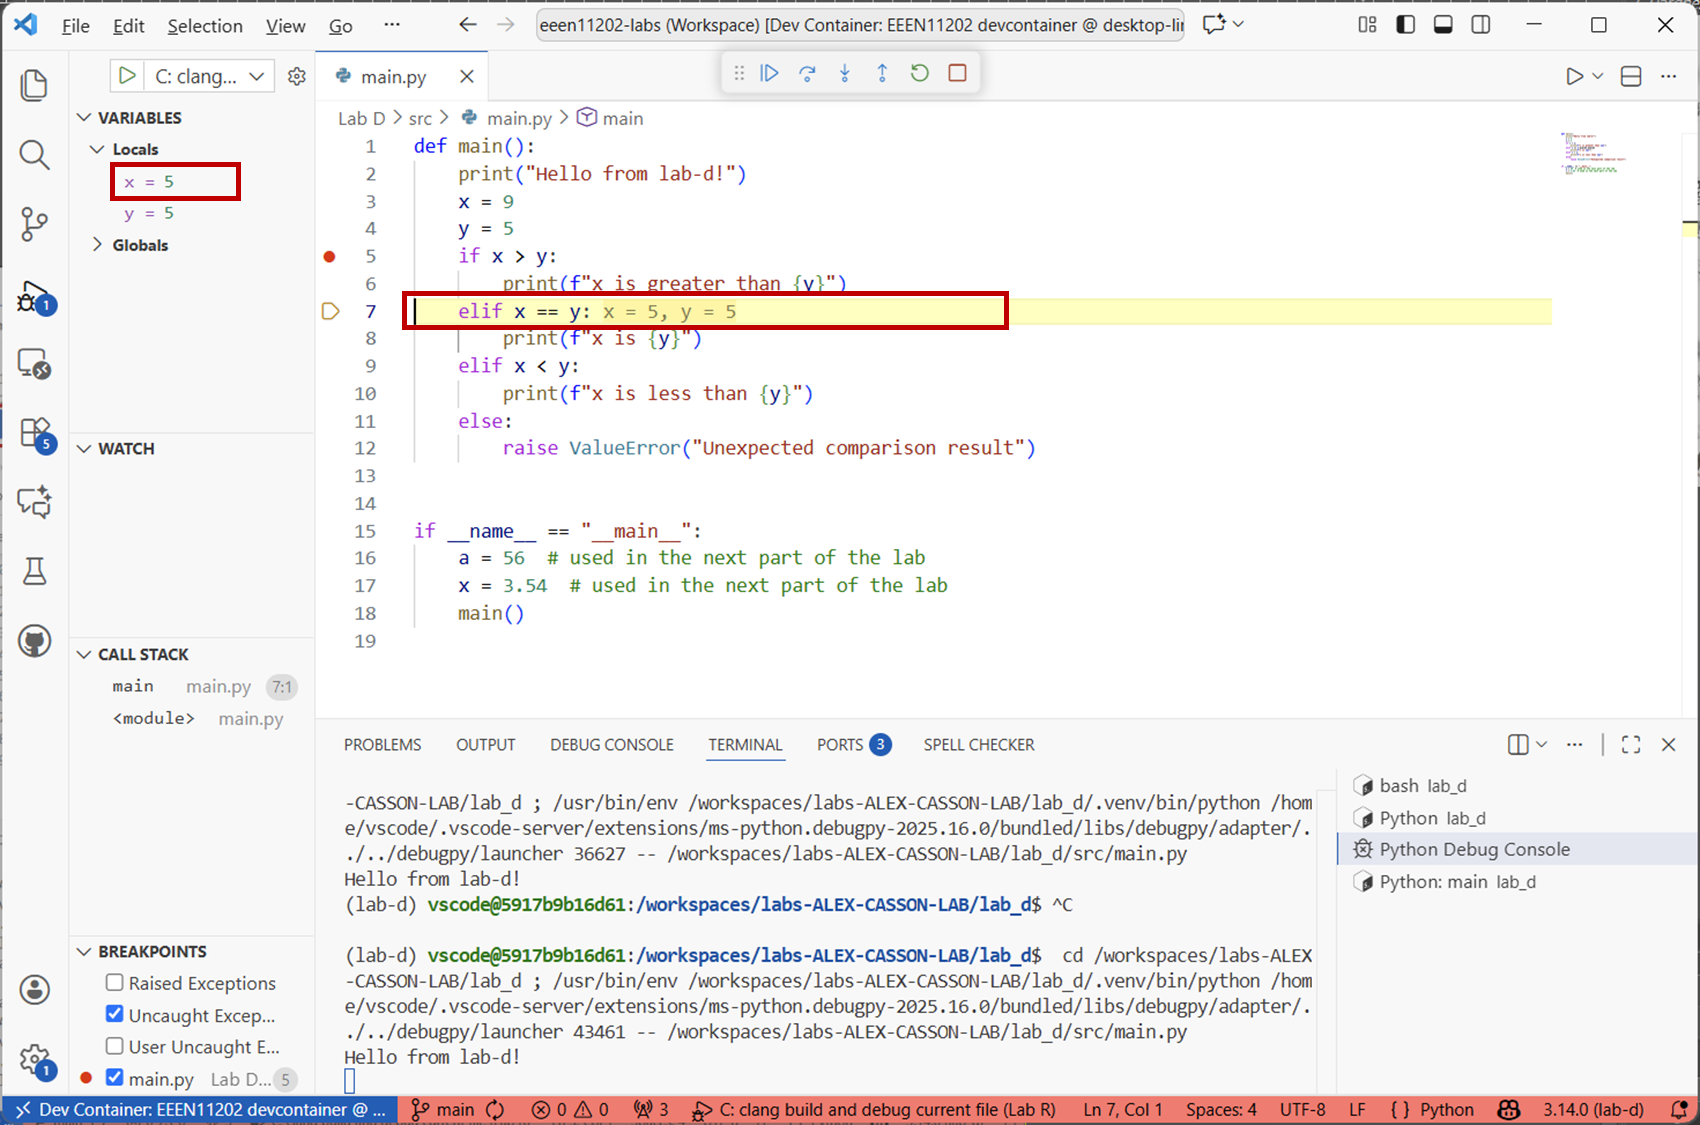
Screenshot of VSCode, software from Microsoft. See course copyright statement.
3.3.1.3.3. Examining the call stack
Stop the debugger and start it again (so that we have the right value for
x).We put our breakpoint on Line 5. This is in a function called
main(), which is called on Line 18 of the code. The debugger lets us view the status of the program when it was stopped (Line 5), and the status of whenmain()was called (Line 18).Click on
<module>in theCALL STACKarea. This lets us switch the view of the debugger to where the function was called. If you have a breakpoint in a function, which was called by another function, which was called by another function, there might be several layers to this stack. Here we just have one, with the top layer called<module>by default.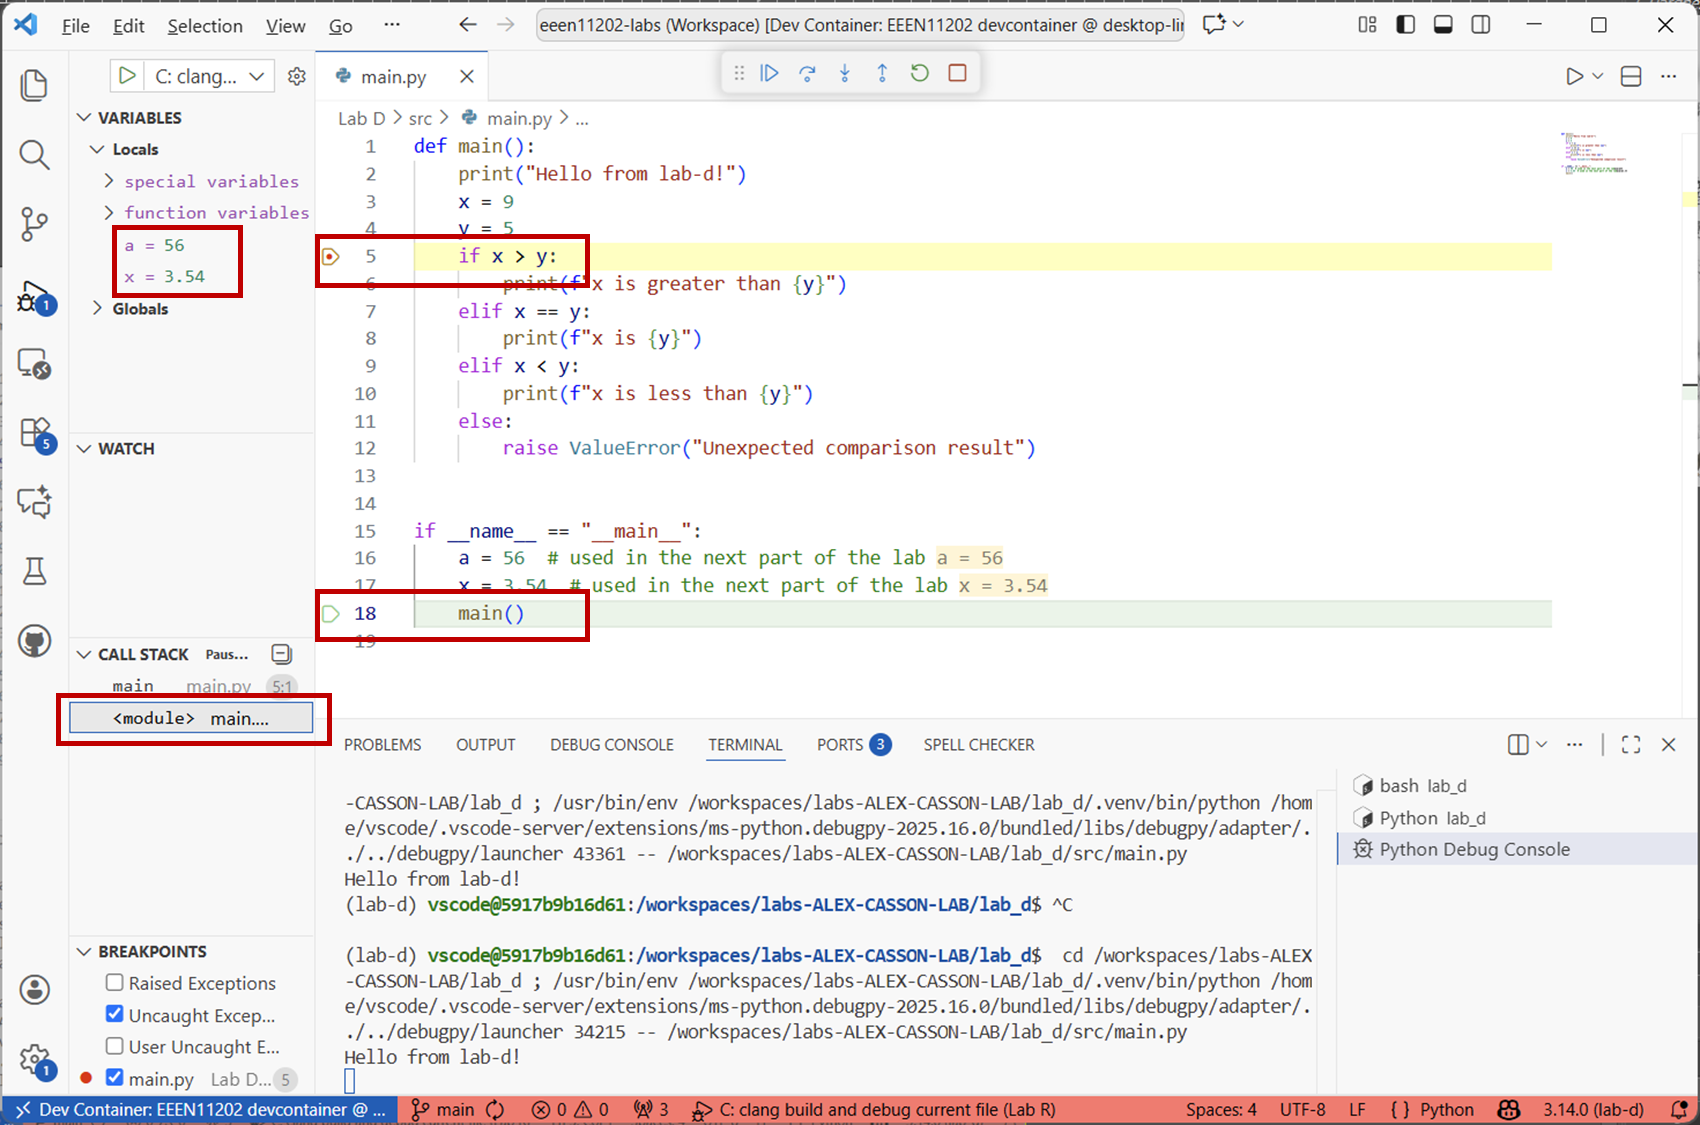
Screenshot of VSCode, software from Microsoft. See course copyright statement.
The debugger now shows which line we’re paused at (in yellow) and where the containing function was called from (in green). As we’re looking at
<module>, the variables shown are the ones that it sees. That is, the value of the variables before we startedmain(). You can see thatx = 3.54in the debugger. Insidemain()x = 9. Both variables have the same name, but as they are in different scopes they don’t conflict with one another. The debugger can be moved between different scopes to help with our debugging.
3.3.1.3.4. Conditional breakpoints
We can also have breakpoints that only trigger in certain conditions. This is very useful for tracking down bugs that only occur in some instances.
Replace the code in your file with that given below.
def countdown(x):
    countdown = range(x,-1,-1)
    for i in countdown:
        print(f"{i}")
    print("Blast off")


def main():
    print("Hello from lab-d!")
    x = 9
    y = 5
    if x > y:
        print(f"x is greater than {y}")
    elif x == y:
        print(f"x is {y}")
    elif x < y:
        print(f"x is less than {y}")
    else:
       raise ValueError("Unexpected comparison result")

    countdown(x)


if __name__ == "__main__":
    a = 56  # used in the next part of the lab
    x = 3.54  # used in the next part of the lab
    main()
This calls a function
countdown()once theifstatement has completed.Put a breakpoint on the line
print(f"{i}"). Then right click on the red circle, and you’ll be given the option toEdit Breakpoint...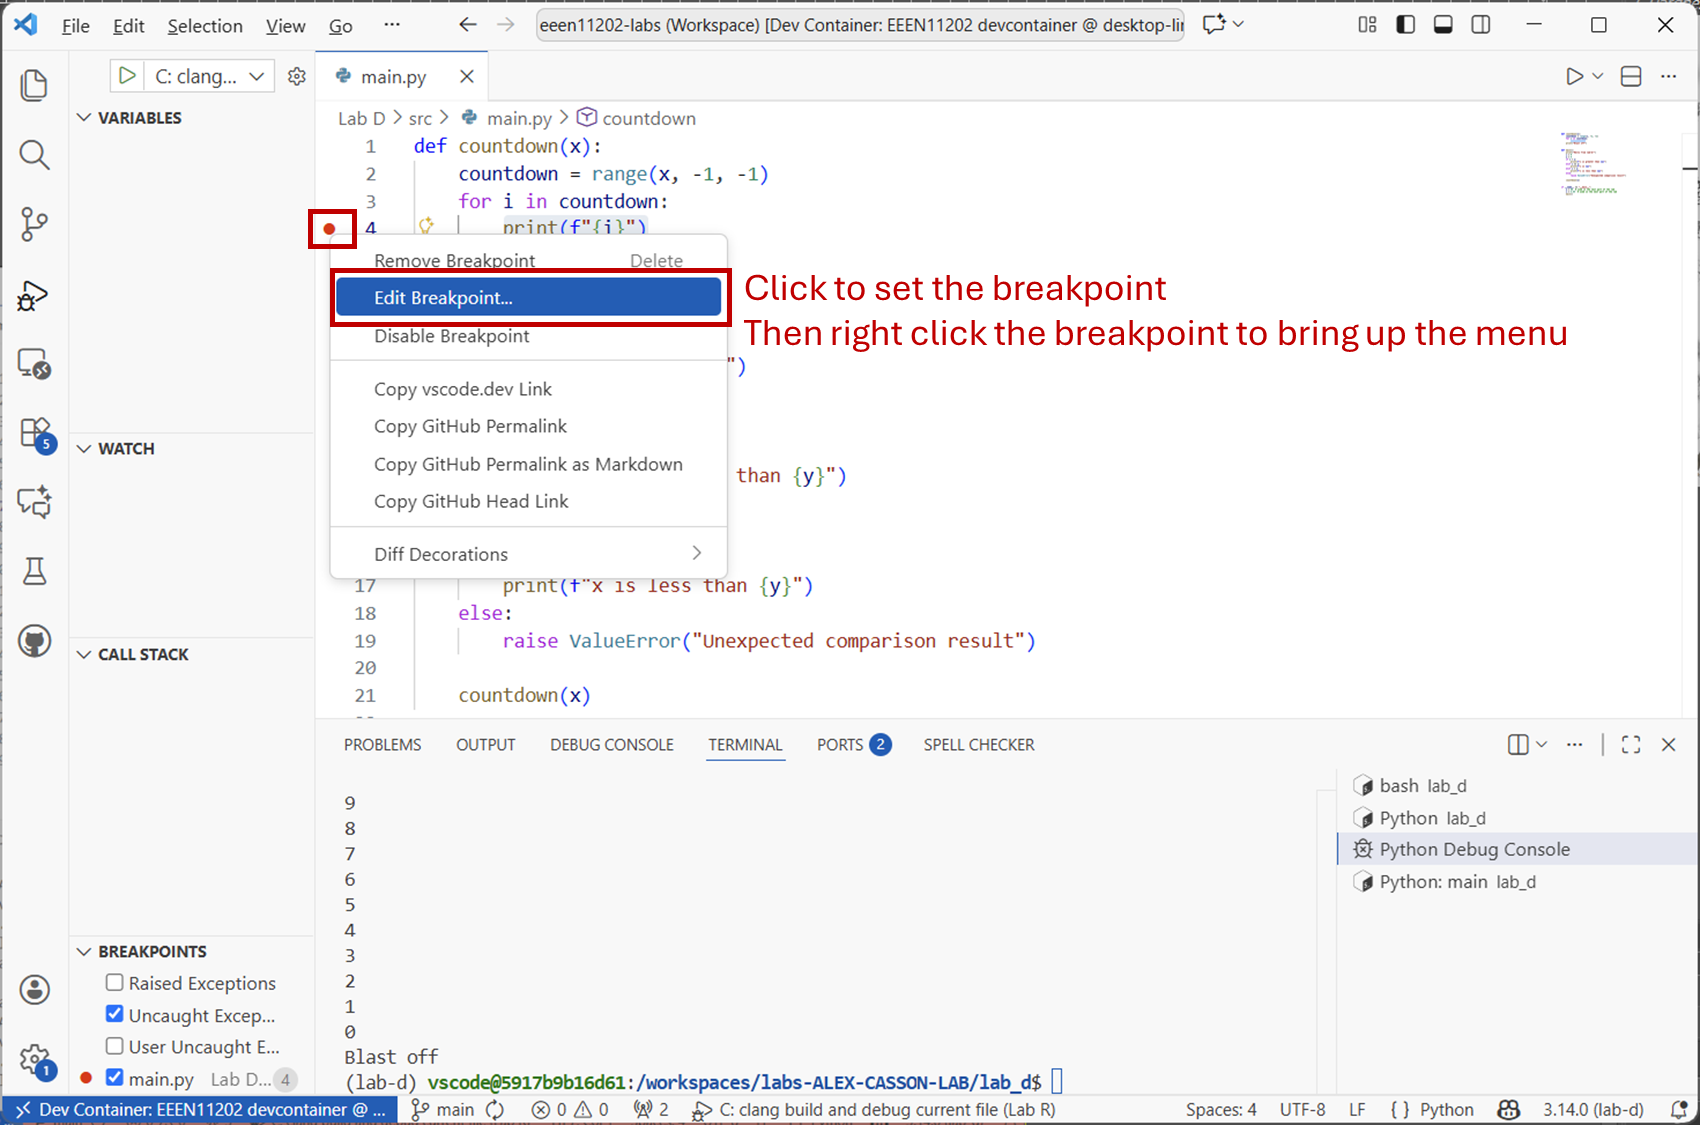
Screenshot of VSCode, software from Microsoft. See course copyright statement.
You can then set an expression that determines whether the breakpoint triggers. You use the same syntax as in an
ifstatement. Type ini == 1and then pressEnteron the keyboard. (Make sure you understand why we’re triggering oniand not onx.) Here we’re using a simple conditional statement, but you can build up more complicated ones if you would like.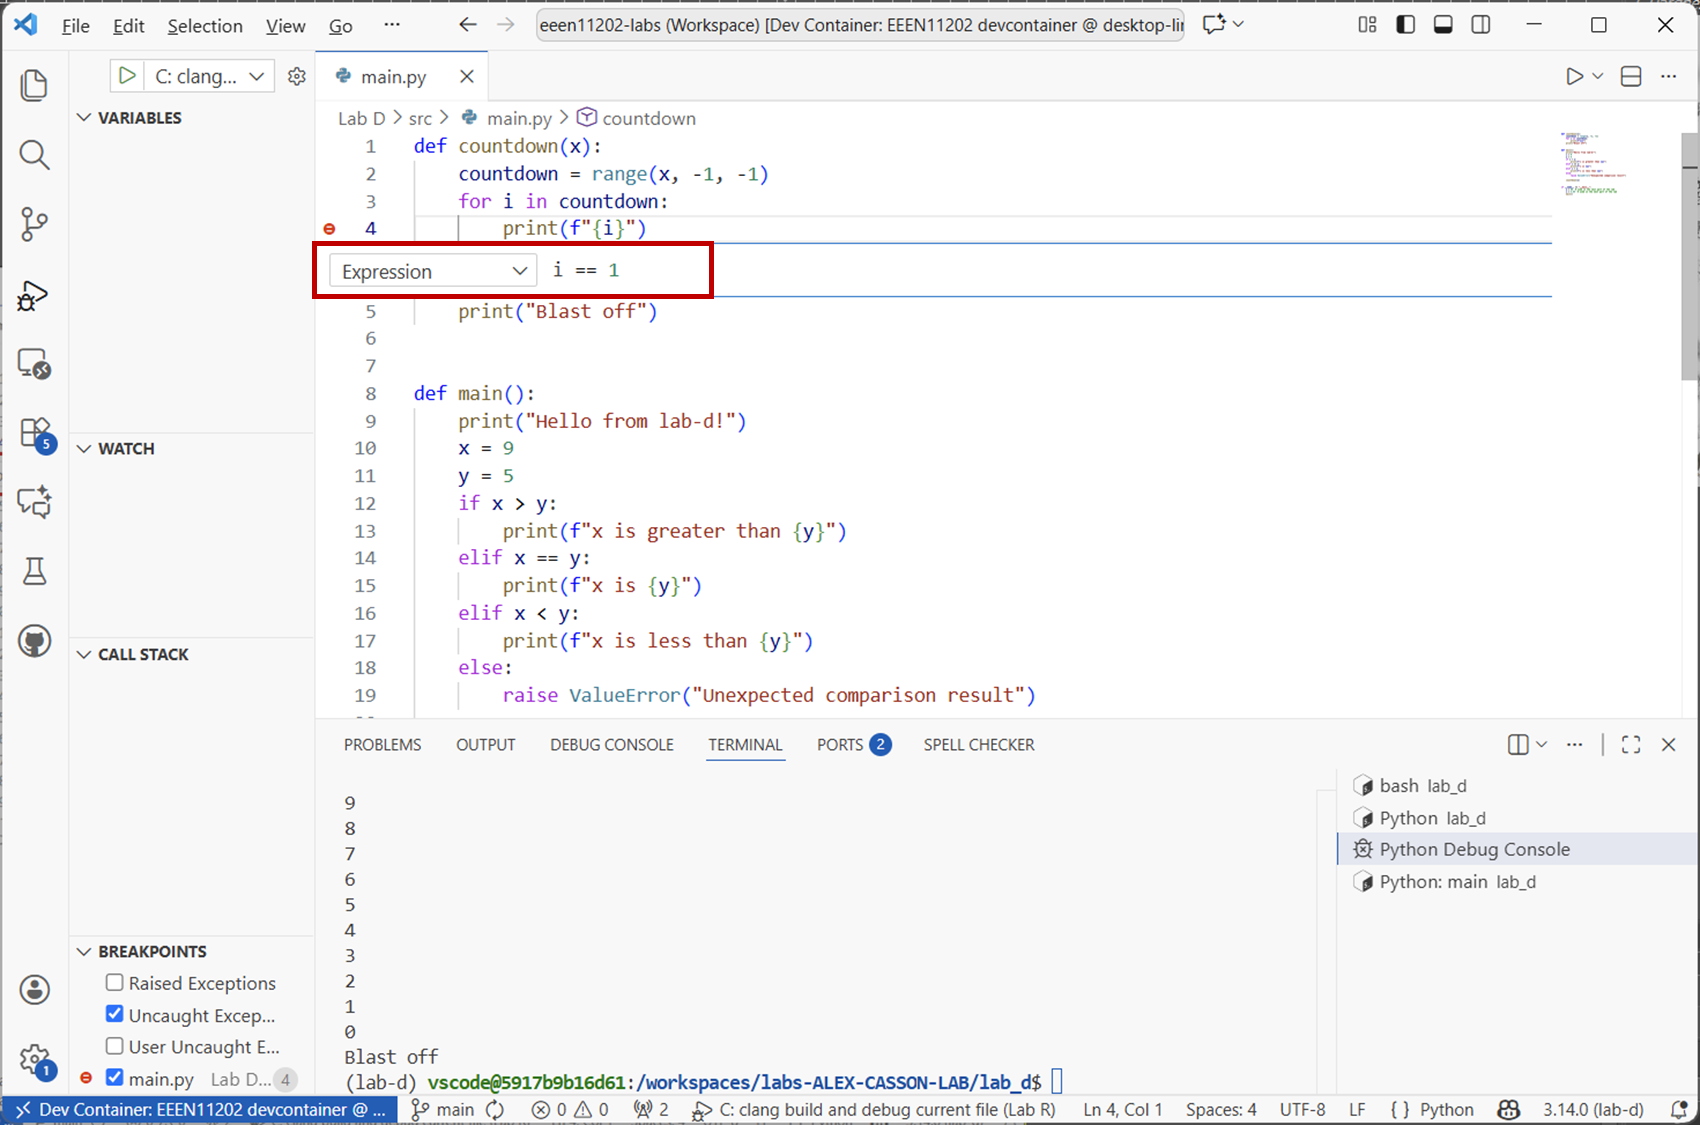
Screenshot of VSCode, software from Microsoft. See course copyright statement.
You should see that the debugger has paused the program when
i = 1. All of theforloop iterations before this have been run. There are now also 3 functions on the call stack.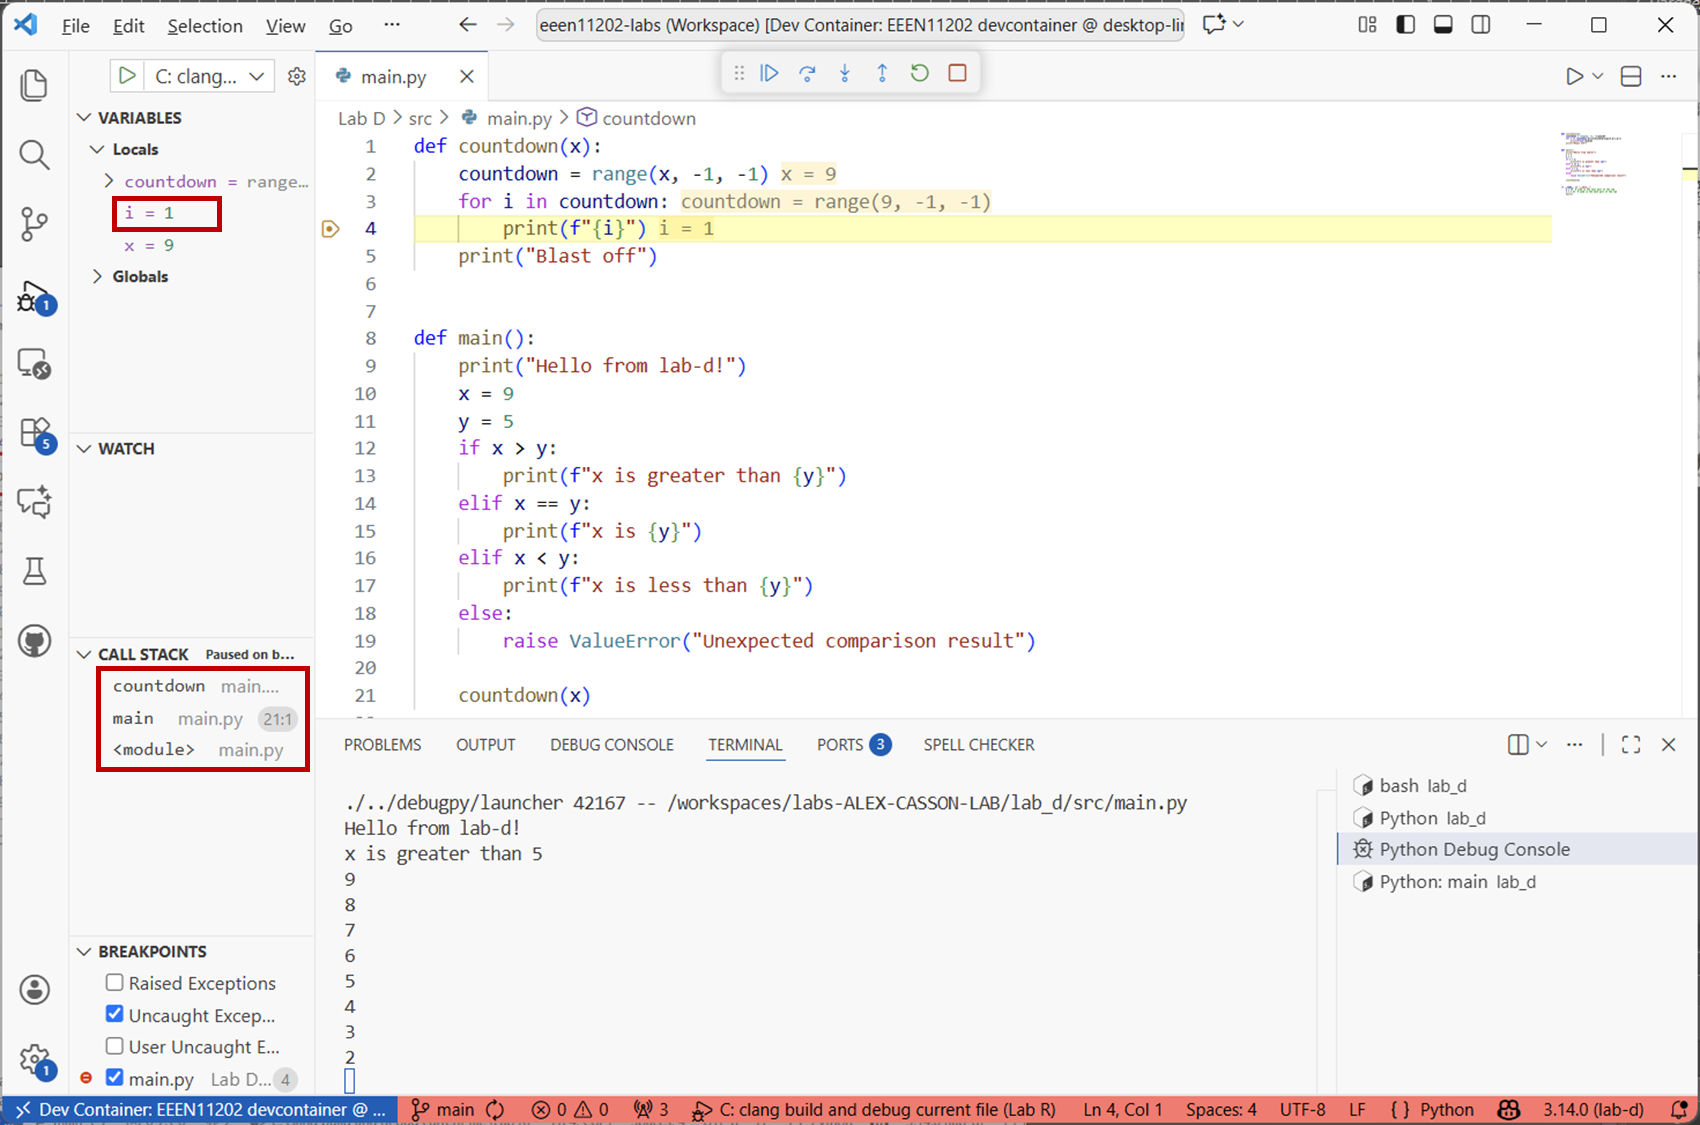
Screenshot of VSCode, software from Microsoft. See course copyright statement.
There’s lots that can be done with the debugger, we’ve just shown a few key features here. Spend some time exploring different options before moving on. We won’t refer back to the debugger again so much in the rest of course, but assume you’ll make use of it to help fix issues in your code and to help check that your code is working as expected.
3.3.1.4. Logging
The debugger is a very powerful tool when we want to interactively work with our code - typically when we want to see the values of particular items and see whether they are what we expect. However, sometimes we just want to run the code, have it do everything, and then have a look at the end at what happened. For example, maybe the code takes a long time to run, and so we’ll leave it running overnight rather than sitting at our computing and waiting for it to reach a breakpoint.
We can make a log file to store values from our program run for later inspection.
Note
You could just use print commands to display the values of variables at different points, e.g. print(f"{i}"), and even save this display to a file. There’s nothing wrong with this per-se, except that:
Python has built in logging functions to make this process smoother and with more power options without having to do everything yourself.
If you have lots of
printcommands for debugging, when you’ve finished debugging you need to remember to remove or comment out all of theprintcommands. Otherwise your code will be creating a load of unnecessary output, and displaying stuff to the screen actually takes a relatively long time which could slow down the program execution. In contrast, logging functions have the ability to be turned on and off via a setting. The code can stay the same regardless of whether you’re debugging it or actually using it, just the setting changes.
As with the debugger, there’s lots of depth that we could go into on logging. We’re just going to touch on a few items, so that you have familarity if you need it, and so you don’t always have to resort to using print statements.
We’re going to use the logging library, which is part of the standard library. This means it is avaiable with all Python installations. Logging is such a common need that there are external libraries, such as loguru which add more functionalty, but we won’t look in to these here.
Make a new Python file, with any suitable name, stored in your
srcfolder for Lab D. Put the code below into it. (Note that you can’t call your filelogging.pybecause this will conflict with the name of the logging library we’re importing.)import logging logger = logging.getLogger(__name__) def countdown(x): countdown = range(x, -1, -1) for i in countdown: print(f"{i}") print("Blast off") def check_x(): logger.info("Hello from lab-d!") x = 9 y = 5 if x > y: logger.info(f"x is greater than {y}") elif x == y: logger.info(f"x is {y}") elif x < y: logger.info(f"x is less than {y}") else: raise ValueError("Unexpected comparison result") countdown(x) def main(): # Set up logging log_filename = "log.txt" logging.basicConfig(filename=log_filename, level=logging.INFO) logger.info("Started") # Run wanted functions a = 56 # used in the next part of the lab x = 3.54 # used in the next part of the lab check_x() # Tidy up logging logger.info("Finished") if __name__ == "__main__": main()
This code is fundamentally the same as we’ve been developing so far in this lab, but the functions are now in
check_x()rather thanmain(). We’ve also added logging commands. For the logging:import loggingandlogger = logging.getLogger(__name__)at the top of the code set up the logging library for use.log_filename = "log.txt"andlogging.basicConfig(filename=log_filename, level=logging.INFO)inmain()configure the logging. Here we’ve asked it to store the log in a file calledlog.txt. We’ve also set the logging level toINFO. We’ll discuss this in a minute.logger.info()sets what we record into the log file. We’ve added some start and stop messages, and otherwise replaced variousprintcommands withlogger.info()commands.
Run this code. You will find that it creates a file called
log.txtin your Lab D folder. If it doesn’t show up straight away, press theRefreshbutton in the VSCode file explorer.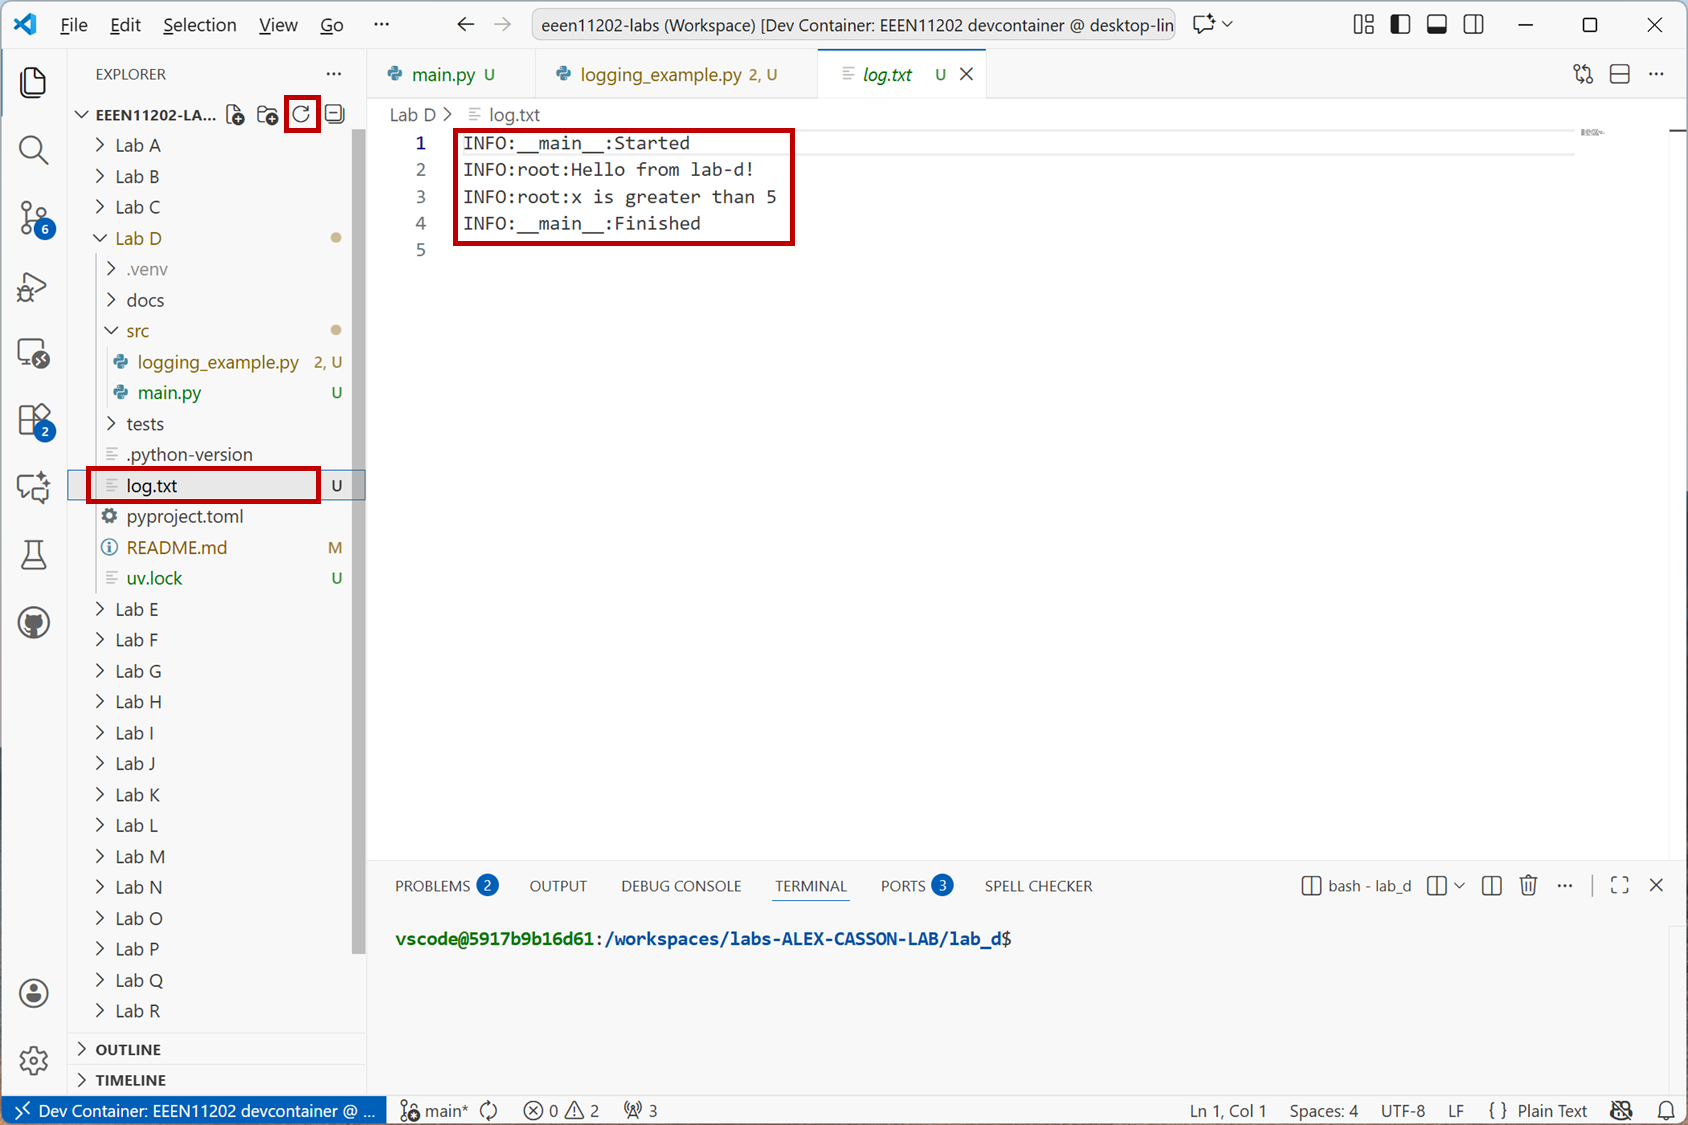
Screenshot of VSCode, software from Microsoft. See course copyright statement.
Rather than being displayed to the screen, our messages are now being logged in a file for us to inspect later on.
If you run the code again, you’ll find that the second run is appended to the end of the log file.
Delete the file
log.txtto start afresh.Change the code line
logging.basicConfig(filename=log_filename, level=logging.INFO)tologging.basicConfig(filename=log_filename, level=logging.WARNING), and run the code again.The log file is now blank. This is because we’ve now asked for only
WARNINGlevel messages to be recorded. Our current code only hasINFOlevel messages, and so nothing is recorded. We can thus get control over how detailed or otherwise we want our logging to be, without having to make lots of changes to the code.The logging library has different levels of logging. From highest to lowest these are:
CRITICALERRORWARNINGINFODEBUG
When setting the logging level, only messages at that level and above are recorded.
In the code you copied for this part of the lab there is a function
countdown(). Change this so that rather than usingprintstatements the countdown is logged at levelWARNING, and the blast off is logged at levelCRITICAL. Run the code with the logging level set toWARNING. You should see that only the countdown numbers are recorded in the log file.Solution
def countdown(x):
    countdown = range(x, -1, -1)
    for i in countdown:
        logger.warning(f"{i}")
    logger.critical("Blast off")
There are lots of ways in which you can customize the log file, but we won’t look into these here. The important point is that, generally,
printstatements should be reserved for when you want to display information to the user. For debugging, logging gives more flexibility and control.Check your files into Git before moving on.